Debugging Burp Extensions

Burp is a very useful tool for just about any type of testing that involves HTTP. What makes it even better is the extension support that it offers. People can compliant the features that Burp has to offer with their own extensions to create a very powerful well-rounded application testing tool that is tailored to their needs. Sometimes, however, our extensions don’t work the way we want and require additional testing. In this blog post, I’m going to walk through how we can setup debugging in Burp and our IDE when we create Burp extensions. Essentially, we are just going to be setting up Java remote debugging. This should hopefully be a useful tutorial for people who are creating buggy Burp extensions and want to figure out why they aren’t working. This should also be especially helpful for first time Java developers who are not accustomed to Java’s debugging capabilities. This will not be a tutorial on creating Burp extensions. For help on that, I’ll refer you to the PortSwigger extender tutorials here.
Requirements
Java SDK (1.7 or 1.8)
Java IDE (I prefer IntelliJ)
Burp Suite (latest free or pro edition)
Getting Started
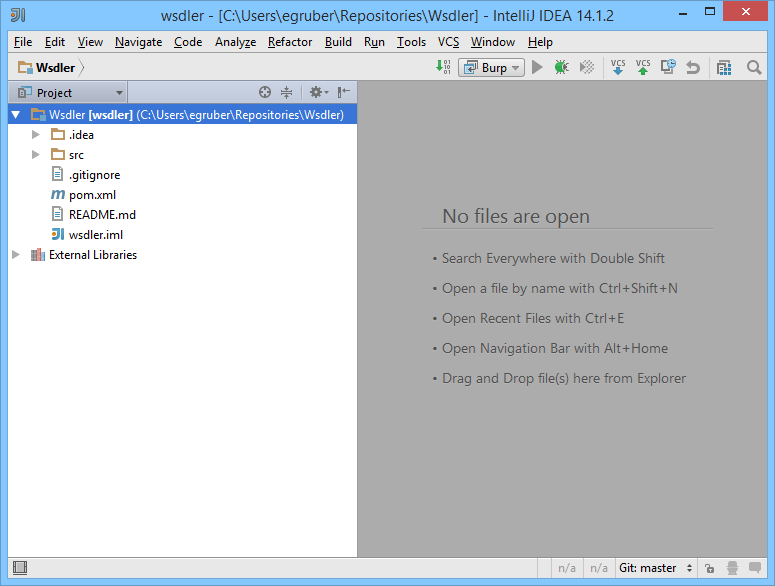
To begin debugging extensions in Burp we first need an extension to debug. For this example, I’ll be using the Wsdler extension I created for parsing WSDL files. If you would like to follow along, the code for Wsdler is located here. We’ll pull this down from git using git clone.
C:UsersegruberRepositories>git clone git@github.com:NetSPI/Wsdler.git
Cloning into ‘Wsdler’…
remote: Counting objects: 458, done.
remote: Total 458 (delta 0), reused 0 (delta 0), pack-reused 458
Receiving objects: 100% (458/458), 19.59 MiB | 221.00 KiB/s, done.
Resolving deltas: 100% (204/204), done.
Checking connectivity… done.
Next, we’ll open this up in our IDE. I’m using IntelliJ, but this can be accomplished using any Java IDE (I think). Select File > Open and navigate to the directory and press OK. IntelliJ should open the directory as a project in its workspace.
Attaching the Debugger
Now that we have our Burp extension in IntelliJ, let’s configure our debugger. Unfortunately, we can’t just hit Run > Debug to start debugging.
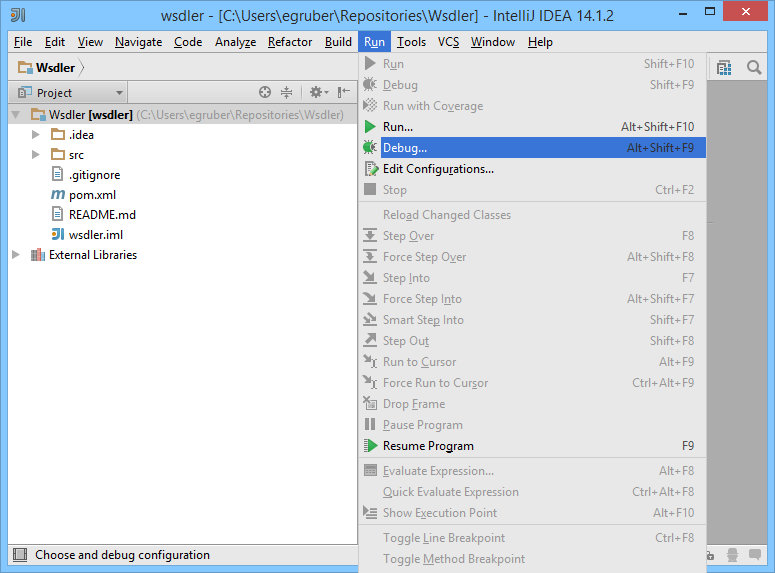
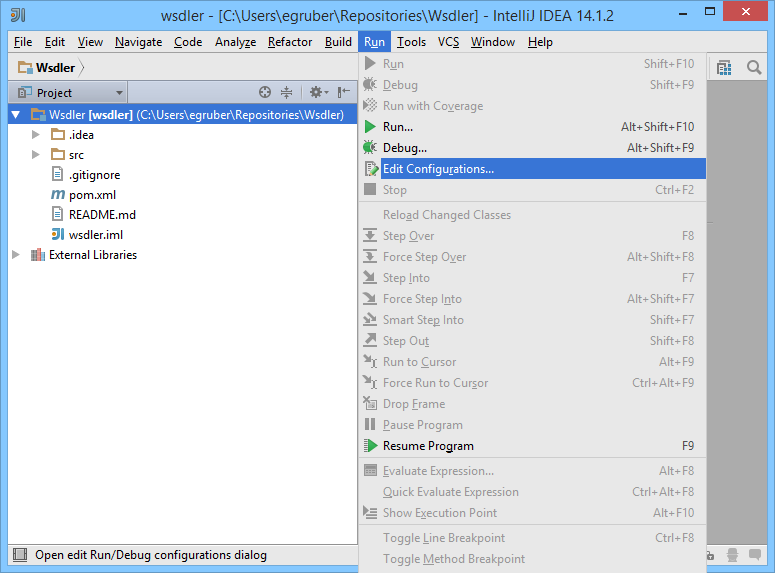
Burp extensions are executed inside Burp. They are generally not standalone jar files with a main class. We can still debug them however with the Java’s remote debugging capability. This allows the debugger to attach to a Java process and send and receive debug information. To do this, select Edit Configurations from Run.
A Run/Debug Configurations window should appear.
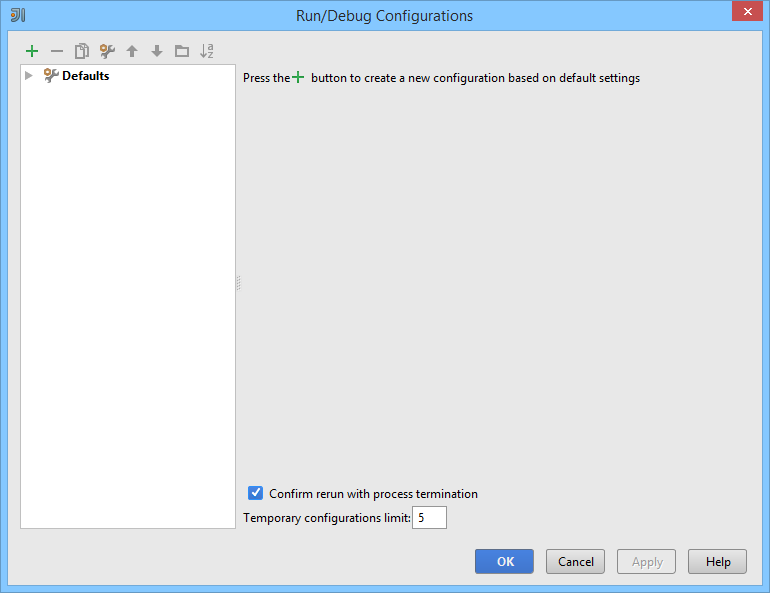
Press the green plus sign and select Remote. You should see a window that looks like this:
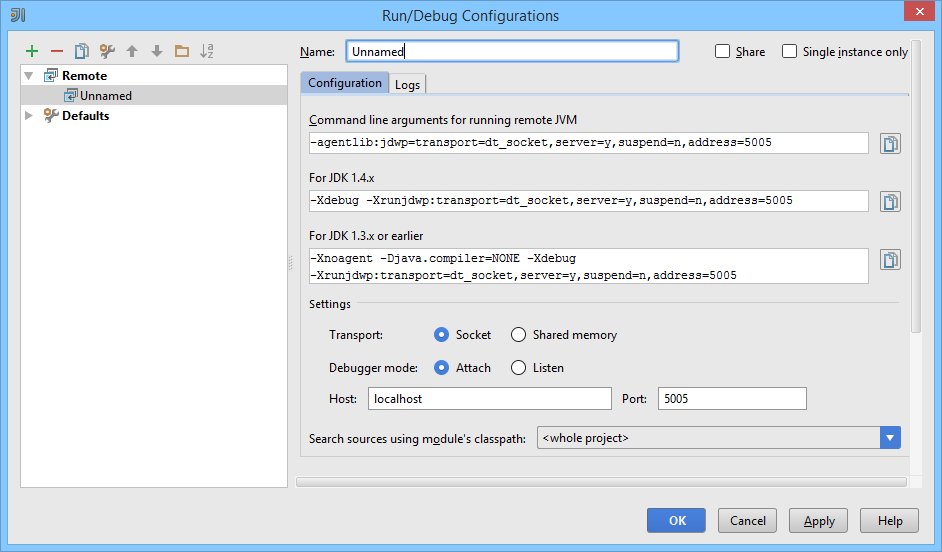
This allows us to setup remote debugging against running processes. Name the configuration whatever you like, I use Burp. Leave all the configuration options set to the defaults unless you know what you’re doing. Next, copy the first command line string. The one that starts -agentlib. You need to add this as an argument to your Java process for the debugger to attach to it. When executed, Java will open up the port 5005 for remote debugging. This allows the debugger to send commands through that port to the JVM process. Press OK at the bottom of the window. You should now see your debug configuration under Run.

Now we need to start Burp with the command line argument from our debug configuration. Open up a command prompt and start Burp with the argument.
C:>java -agentlib:jdwp=transport=dt_socket,server=y,suspend=n,address=5005 -jar burpsuite_pro_v1.6.18.jar
Listening for transport dt_socket at address: 5005
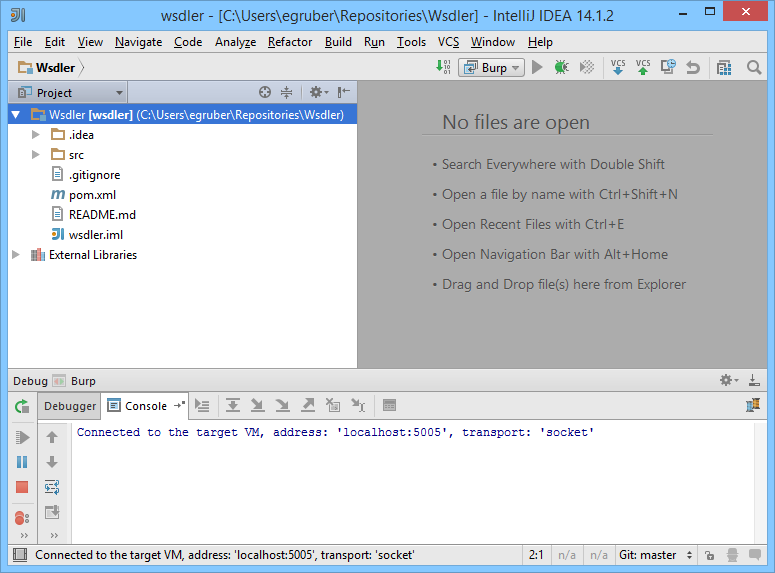
The JVM should now be listening on port 5005, the port we specified in our configuration. Next, we’ll go back to our IDE and select Run > Debug Burp. The console window should pop up saying it is connected to the target VM.
Setting Breakpoints
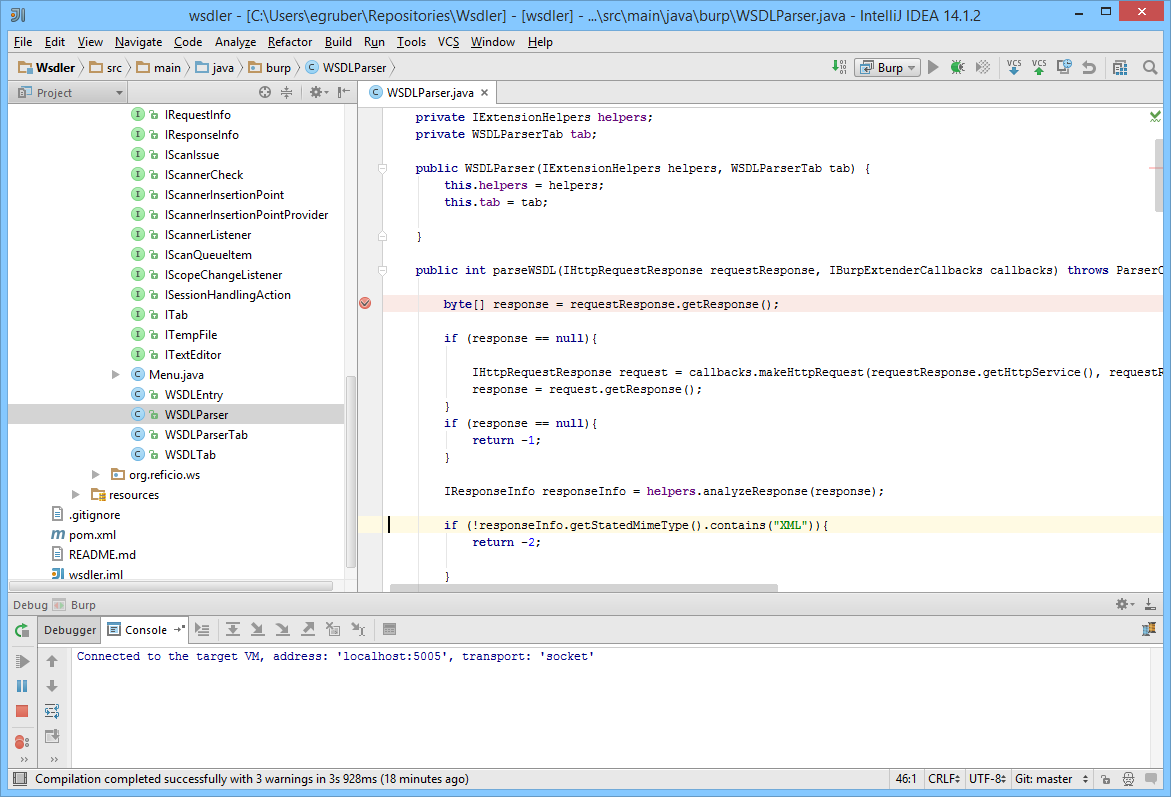
Now that we have our debugger attached to Burp we can start setting breakpoints in our extension code. First, make sure your extension is actually loaded in Burp’s extender!
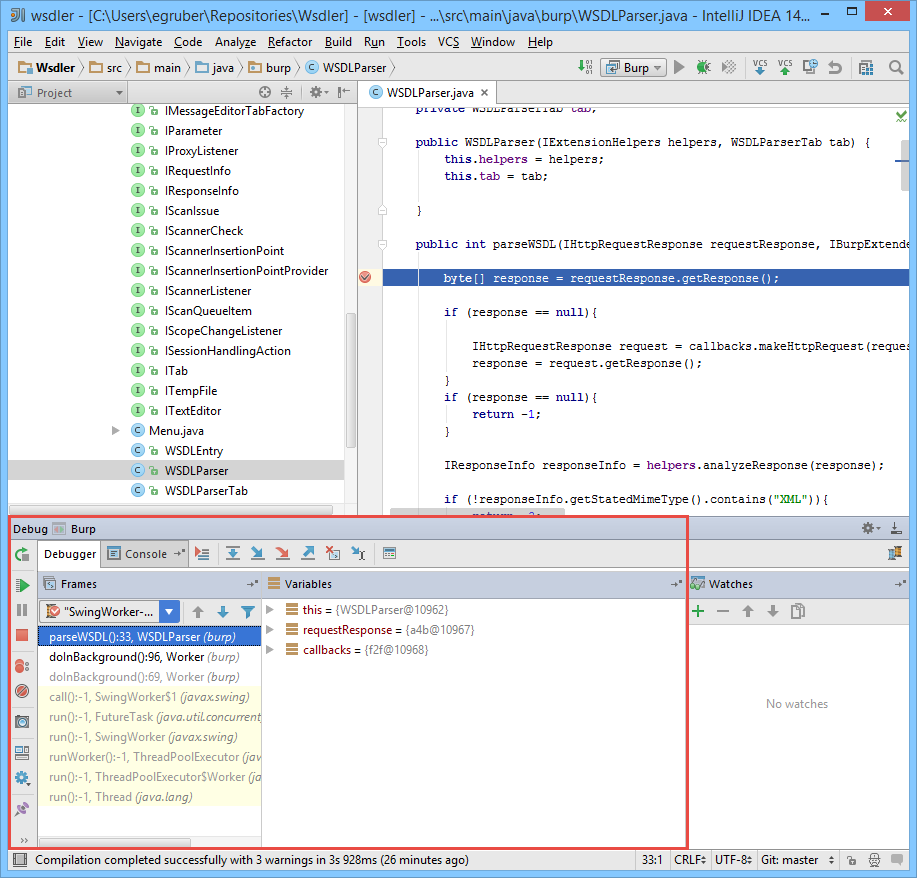
When setting breakpoints, try not to set them on method names themselves. This can slow down Burp considerably. Instead, set breakpoints on lines of code within the methods you want to debug. The first breakpoint I’m going to set is within the WSDL parsing method in my extension. We will pause execution at the point the response byte array is set.
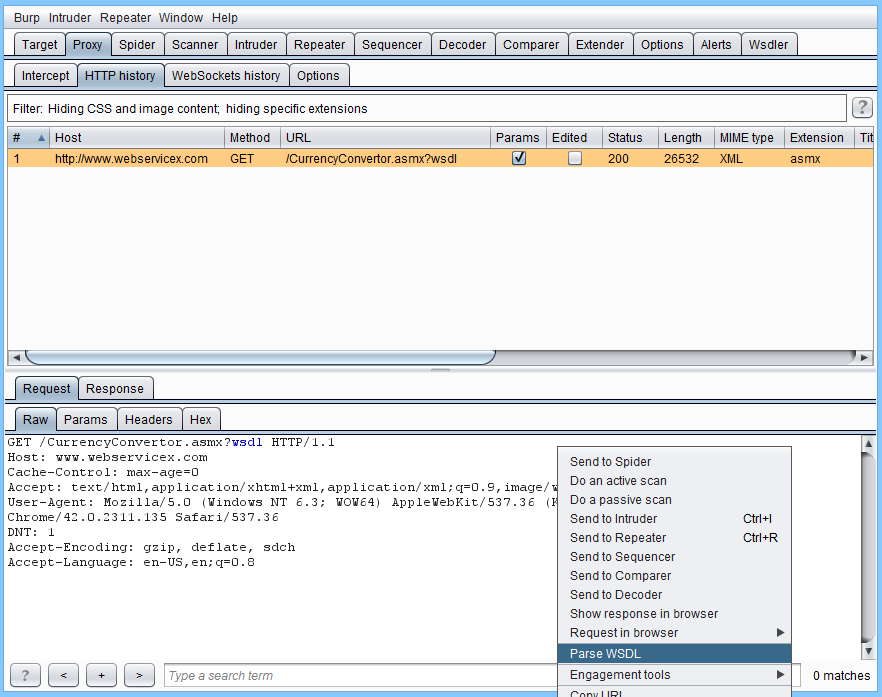
If everything is setup, go back to Burp and execute whatever is needed for you extension to be used. In this example, I will right click on the request I want to parse the WSDL from and select Parse WSDL.
Our debugger should pause on the breakpoint immediately and display the current frames and variables.
We can walk through the code by selecting the step buttons on the top of the debugging menu.
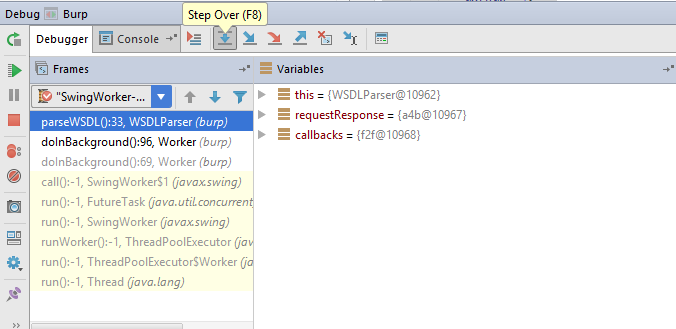
Stepping over the response assignment should reveal the response variable in the variables section of the debug console. The debugger should also be on the next line of code.
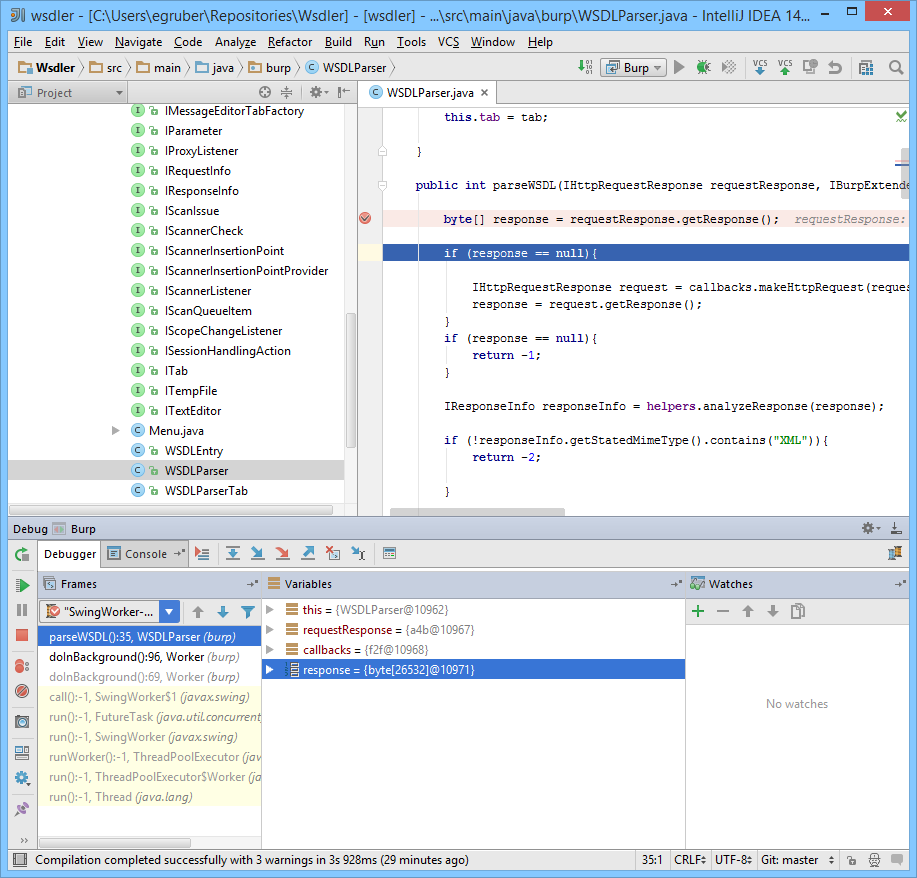
We can go further and step inside functions, but I’ll leave that out for now.
Conclusion
Hopefully this little tutorial is somewhat helpful when trying to fix your Burp extensions through debugging. I know I have spent hours debugging my own extensions and the Java debugger is immensely more helpful than having System.out.println() statements everywhere.
Explore More Blog Posts

Confidence Over Noise: Introducing Continuous AI Findings Validation
NetSPI's Continuous AI Findings Validation service applies expert human judgment to AI-generated security findings, eliminating false positives and verifying severity so security teams can trust, prioritize, and act with confidence instead of chasing noise.

Bypassing Microsoft Entra Conditional Access Policies via Nested App Authentication
Discover how attackers bypassed Microsoft Entra Conditional Access Policies using Nested App Authentication (NAA) flows in this technical vulnerability breakdown.

I’m Just Asking Questions: Social Engineering as a Reporter
Dive into this real-world social engineering assessment where a fake anonymous tip and an adversary-in-the-middle framework tested the limits of an organization's security policies.