Attacking Android Applications With Debuggers
In this blog, I am going to walk through how we can attach a debugger to an Android application and step through method calls by using information gained from first decompiling it. The best part is, root privilege is not required. This can come in handy during mobile application penetration tests because we can step into an application while it’s running and potentially obtain and write information that we normally wouldn’t have access to. Some examples include intercepting traffic before it is encrypted, obtaining encryption keys when they are being used, and obtaining passwords and other sensitive data when they don’t touch the disk. This blog should be interesting to mobile penetration testers and developers who are trying to gain a better understanding of possible attacks on the Android platform.
- Requirements
- Setting up the Device
- Determining Debuggability
- Modifying the AndroidManifest.xml to Enable Debugging
- Setting up the IDE
- Dumping the APK and Decompiling to Source
- Attaching the Debugger
- Conclusion
Requirements
Below is a list of requirements for performing the attacks covered in this blog.
- Windows/Mac OS X/Linux
- Java (1.7 Recommended)
- IDE (Eclipse, IntelliJ IDEA, Android Studio)
- Android SDK (https://developer.android.com/sdk/index.html?hl=i)
- APKTool (https://code.google.com/p/android-apktool/)/APK Studio (https://apkstudio.codeplex.com)
- Android Device/Emulator
- Dex2Jar (https://code.google.com/p/dex2jar/)
- JD-GUI (https://jd.benow.ca/)
For this blog I will be using Windows 8, Android Studio, and IntelliJ IDEA. The device I am using is a stock Nexus 4 running Android 4.4.4. I recommend that all the tools are added to your path environment variable so they can be easily accessed.
For those of you who want to use the APK I am using in this blog, you can download it here:
Setting up the Device
The instruction below walks through how to get your device ready for testing.
Enable Developer Options
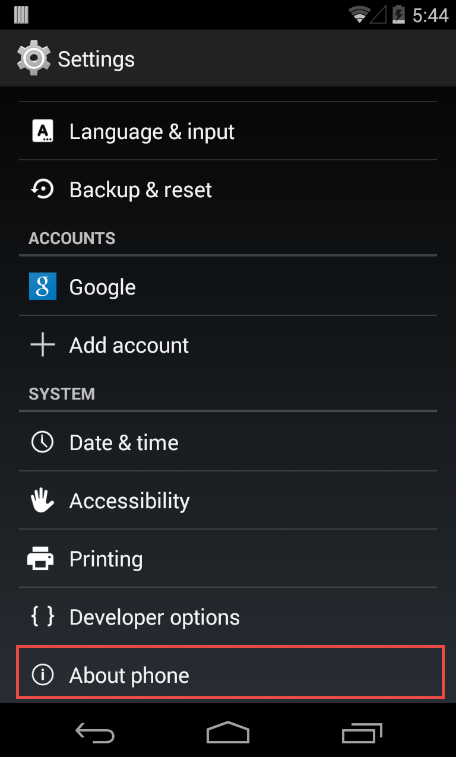
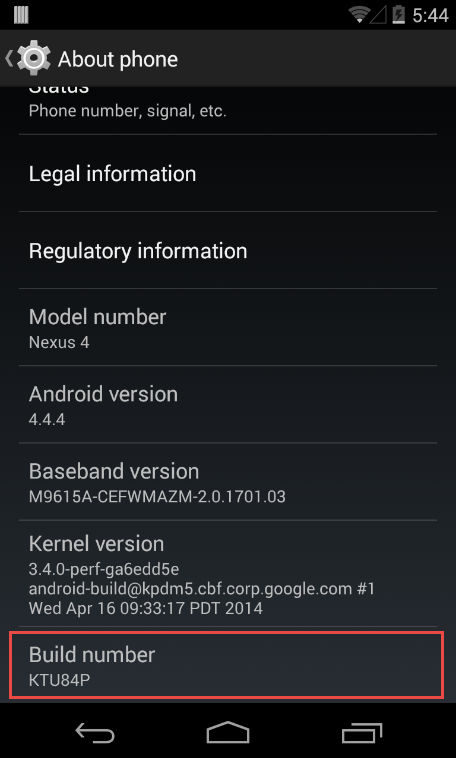
The first thing we need to do is make sure our Android device has USB debugging enabled. This is so we can communicate to it using the Android SDK tools. To do this we need to enable the Developer options. If you are running a stock Android device then this can be done by navigating to Settings > About Phone and tapping on the Build Number multiple times. Eventually it should say that the Developer options have been enabled.
Enable USB Debugging
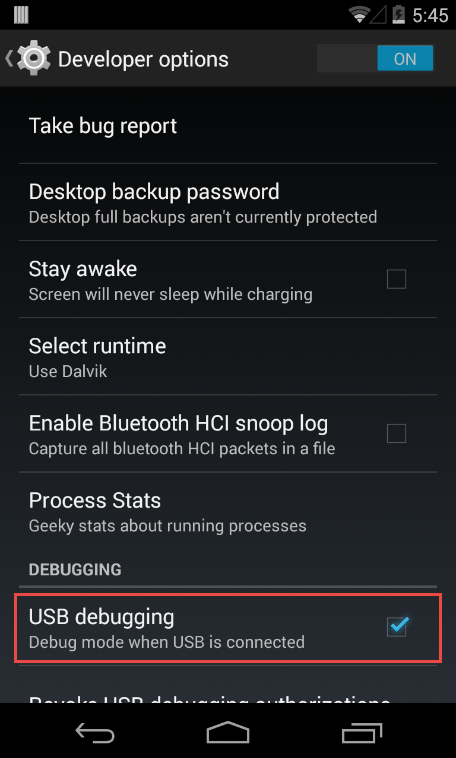
Next we access the Developer options by going to Settings > Developer options. Then we can enable USB debugging.
Plug-in Device via USB and Start ADB
After plugging the device into your computer, it should say, “USB debugging connected on the device”. We also want to make sure that we can connect to the device with the Android Debug Bridge (ADB). This is software included within the Android SDK under platform-tools. By typing:
adb devices
in a shell our device should come up and look like this:
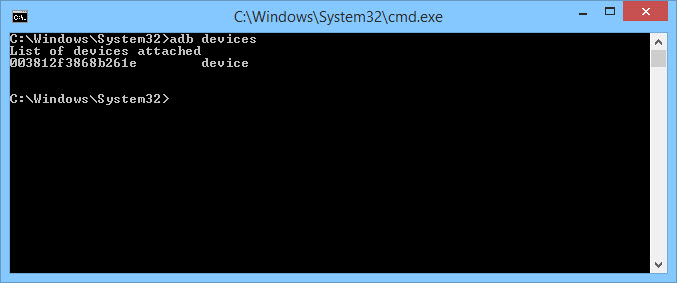
If your device does not come up, the most likely reason is because the correct driver has not been installed (on Windows). Depending on the manufacturer, this can be obtained from the Android SDK or the manufacturer website.
Determining Debuggability
When debugging Android applications, we first have to check whether or not the application is set to be debugged. We can check this in a few different ways.
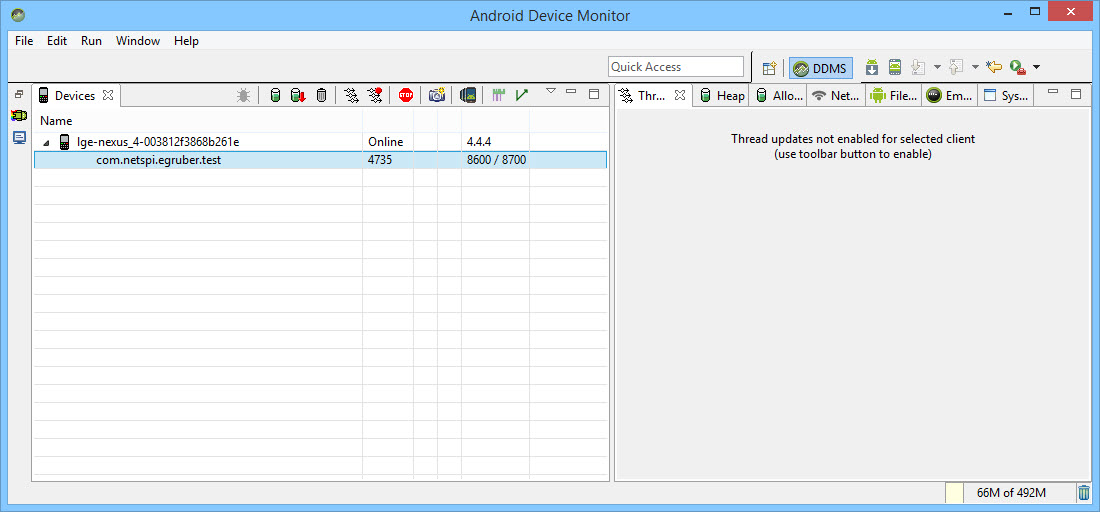
The first way is to open the Android Device Monitor in the Android SDK under the tools directory. On Windows it will be called monitor.bat. When we open the Android Device Monitor, we can see our device listed in the Devices section.
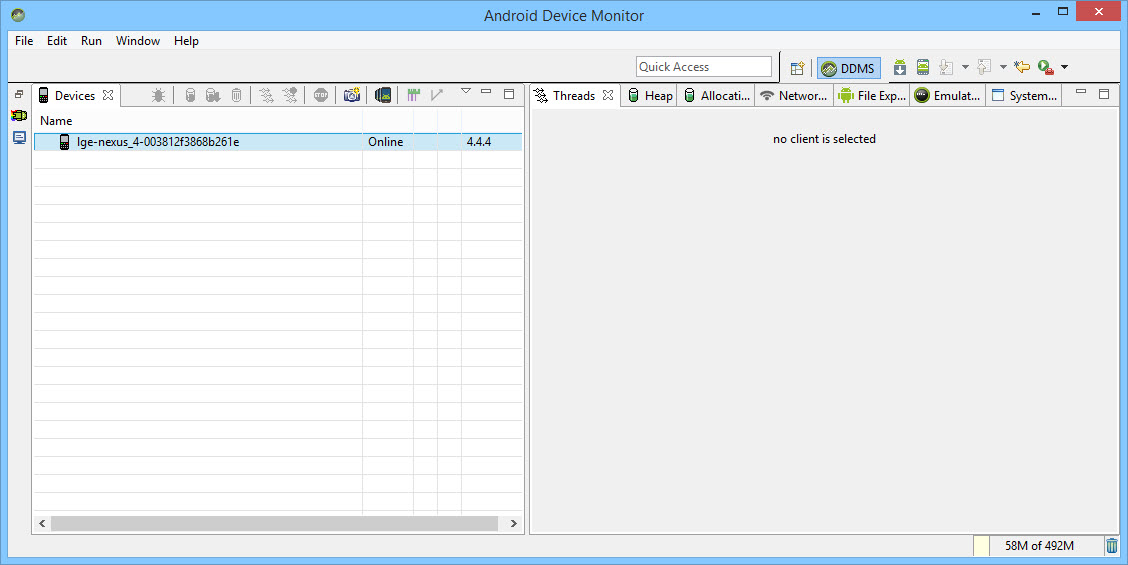
If any application on the device is set as debuggable, then the application would show up here. I created a test application and we can see here that it is not set to be debuggable.
The second way we can check for debuggability is by looking at the AndroidManifest.xml file from the APK of the application. An APK is essentially a zip file of all the information our application needs to run on an Android device.
If you do not have the APK for your application, then we have to pull it off of the Android device. Whenever an application is downloaded from the Google Play Store, it downloads the APK of the application and stores it on the device. The location of all the downloaded APK files are usually stored in /data/app on the device. If your device is not rooted, then you will not be able to list the files in the directory. However, if you know the name of the APK, then it can be pulled down using the adb tool. To find the name of the APK we want to pull down, open a shell and type:
adb shell
This will give us a shell on the device. Then type:
pm list packages -f
This will list all the packages on the device.
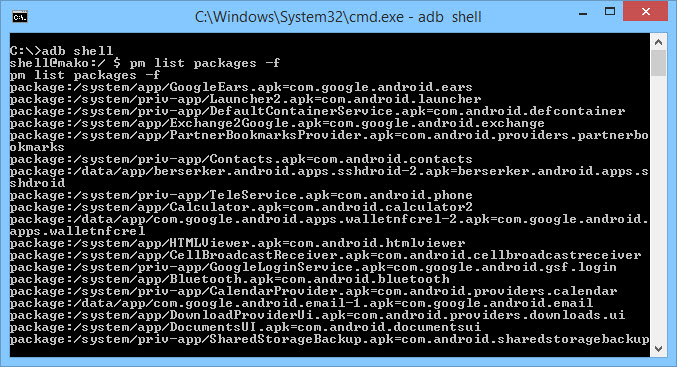
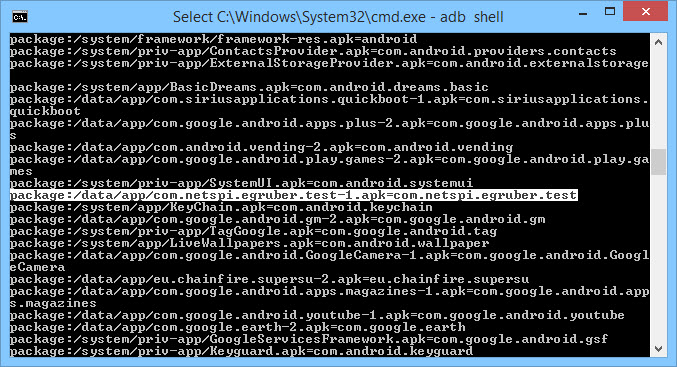
Looking through the list we can find the application we want.
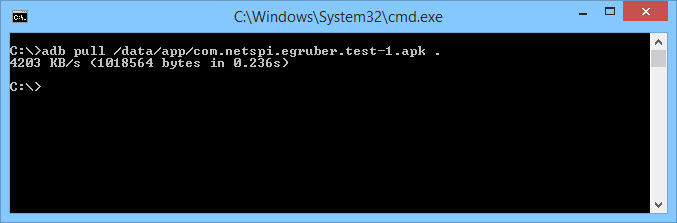
Next, we need to pull down the APK. To do this, open a shell and type the following command:
adb pull /data/app/[.apk file] [location]
Now that we have our APK, we want to open it and look at the AndroidManifest.xml file. Unfortunately, we can’t unzip the APK and view the xml file. It is binary encoded and must be decoded. The most popular tool to do this is apktool. However, I have been using the tool APK Studio recently because it has a nice GUI which is easy to navigate. For the rest of the blog I will be using APK Studio.
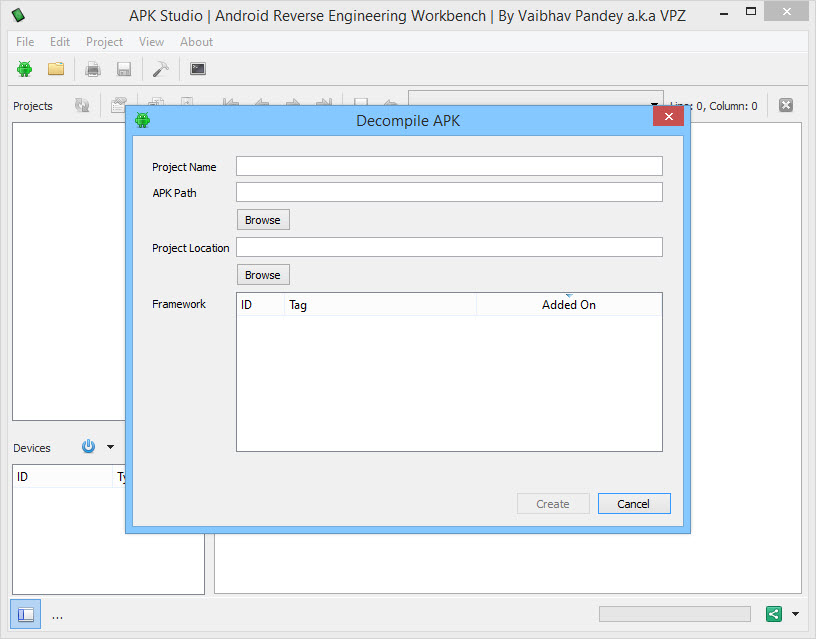
To begin using APK Studio, select the little green android icon. Give your project a name and select the APK for APK Path. Then, give a location that everything should be saved to.
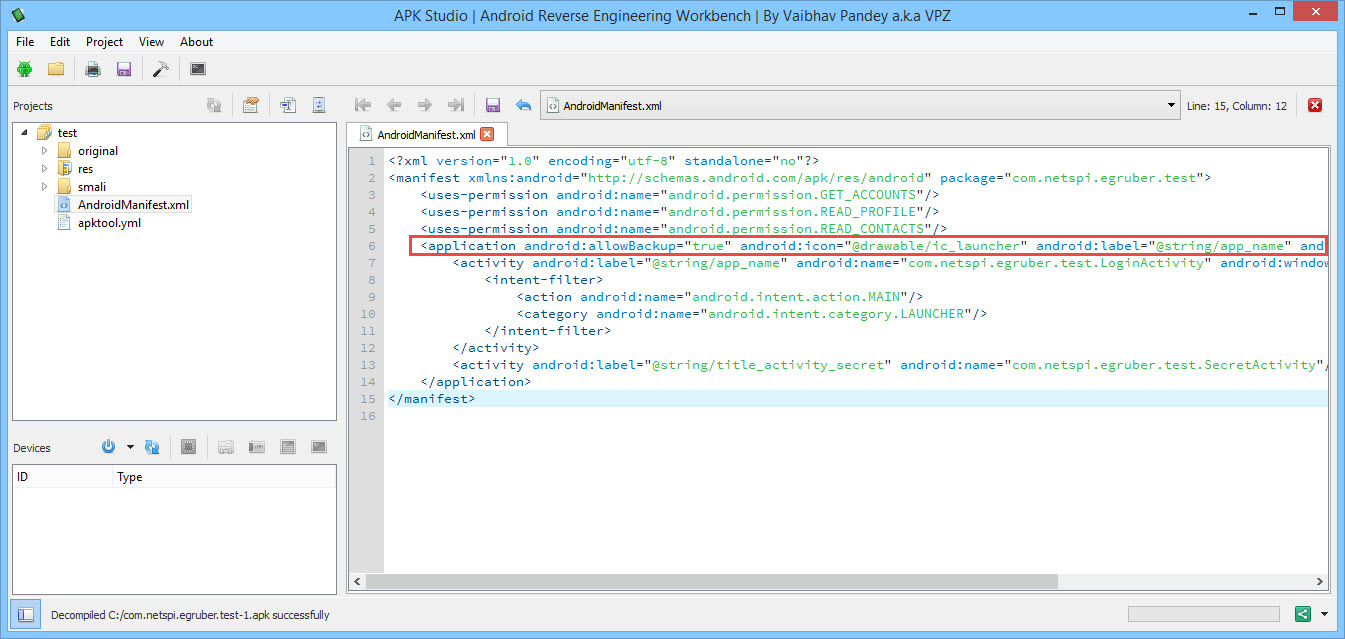
After opening the APK, select the AndroidManifest.xml file and look at the application node. If there is no flag that says android:debuggable , then the APK is not debuggable. If there is a flag that says android:debuggable=”false” , then the APK is also not debuggable.
Modifying the AndroidManifest.xml to Enable Debugging
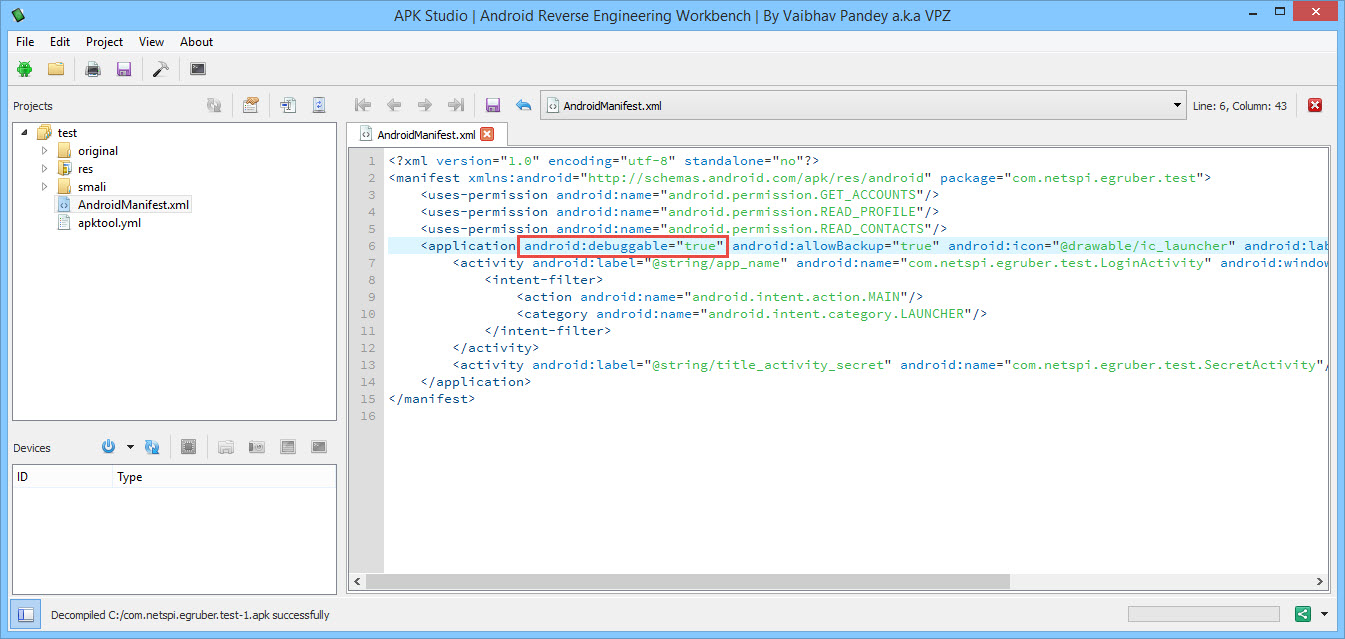
The nice thing about apktool and APK Studio is that we can edit any of the decompiled Android files and recompile them. That’s what we’re going to do here. We are going to make the application debuggable by adding in the android:debuggable flag. Edit the AndroidManifest.xml so that the application node contains android:debuggable=”true”.
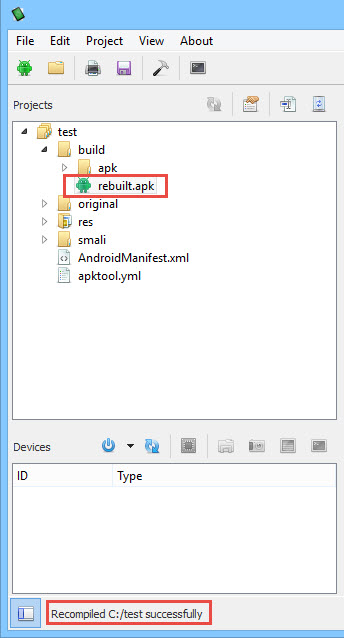
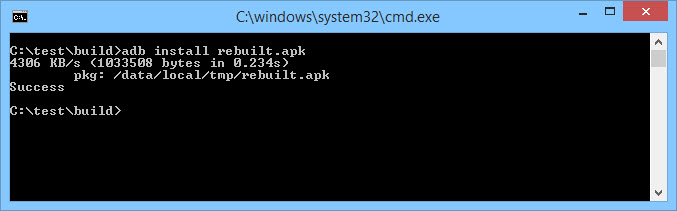
After we have added that flag, rebuild the APK by selecting the hammer icon in the menu. Our rebuilt APK file should be located in the build/apk directory.
Rebuilding the application will also sign it so that it can be installed back on the device. All Android applications have to be signed. Most applications don’t check if they were signed by the original certificate. If your application does check, then this may not work unless the portion of code that checks is edited as well.
Next we need to install our newly rebuilt APK. First, uninstall the application on the device. This can be done from the command line using adb:
adb pm uninstall[package name]
Then install using:
adb install [.apk file]
You can also uninstall and reinstall the APK with the following command:
adb install -r [.apk file]
Check and make sure that the reinstalled application runs correctly on the Android device. If everything is working, go back to the Android Device Monitor and our application should now appear under the Devices section.
Setting up the IDE
Now that our application is marked as debuggable, we can attach a debugger to it. But before we do that, we need to setup our IDE for the application we want to debug. For this blog, I am using IntelliJ IDEA. To begin, I am going to create a new Android Project. The application name can be anything, but the package name has to be the same name as the APK package structure.
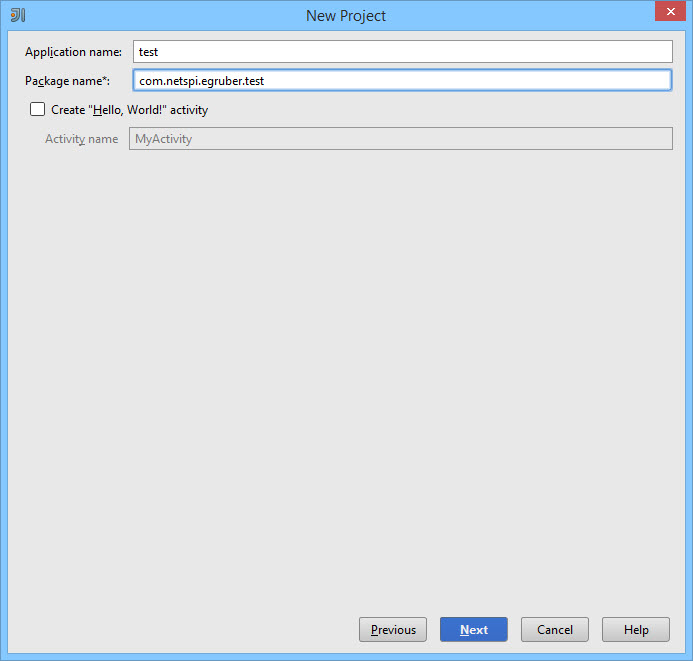
This can be as easy as the name of the APK. However, if you are still not sure, you can look at APK Studio and follow the package structure to where the application files are located. For my application, the package structure is the name of the APK, “com.netspi.egruber.test”. This can also be seen in APK Studio.
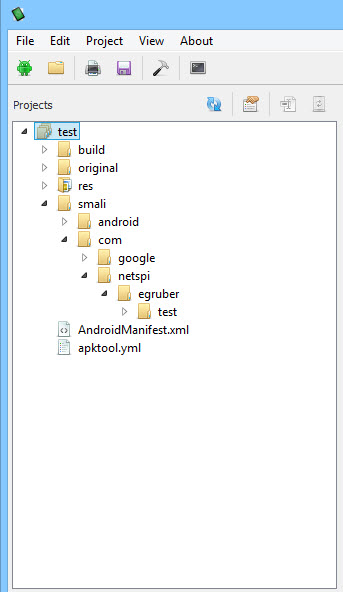
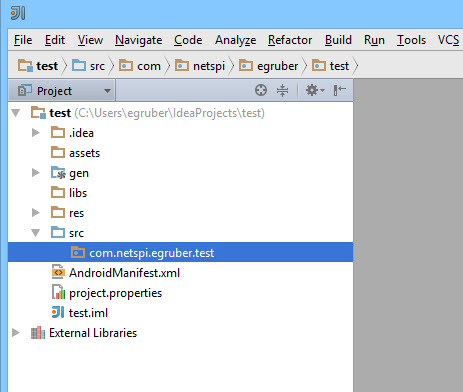
Uncheck the “Create Hello World Activity” checkbox and finish creating the project by selecting the default values. After that is done, your project layout should now look like this:
Now that we have our project created, we need to populate it with the source code from the Android APK. The reason we need to do this is so the debugger knows the name of the symbols, methods, variables, etc… for the application. The nice thing about Android applications is that they can be decompiled rather easily back to mostly correct java source code. We need to do this and import all of it into our project in the IDE.
Dumping the APK and Decompiling to Source
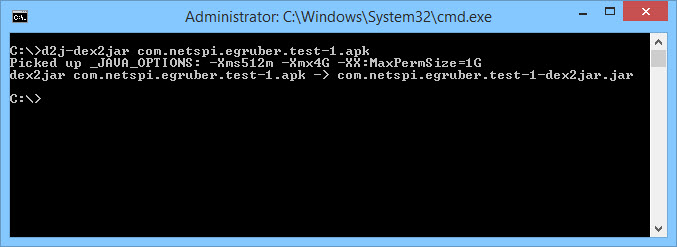
The first thing we need to do to get the source code back from the Android application is to convert the APK file to a jar file. We can then use a java decompiler to retrieve the java source code. To do this, we are going to use the tool dex2jar. Dex2jar contains the bat file d2j-dex2jar that can be used to convert an APK to a jar file. The syntax is simple:
d2j-dex2jar.bat [.apk file]
You should now have a jar file of the APK. Next we are going to use the Java decompiler JD-GUI to open the jar file. Simply open the jar file or drag it into the workspace of JD-GUI.
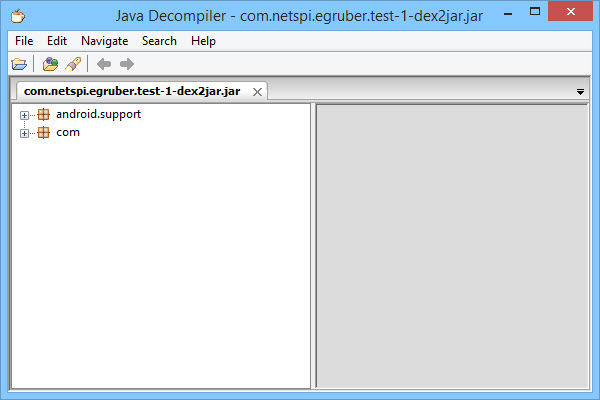
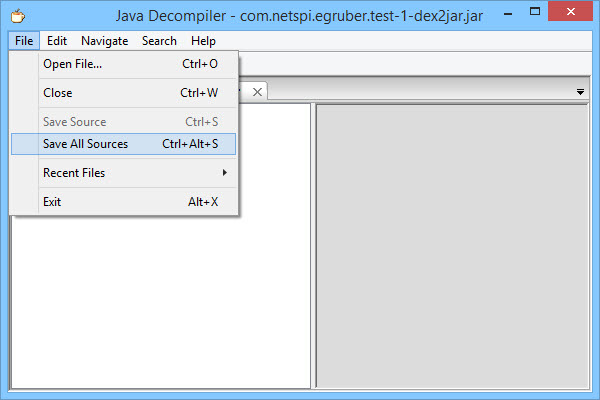
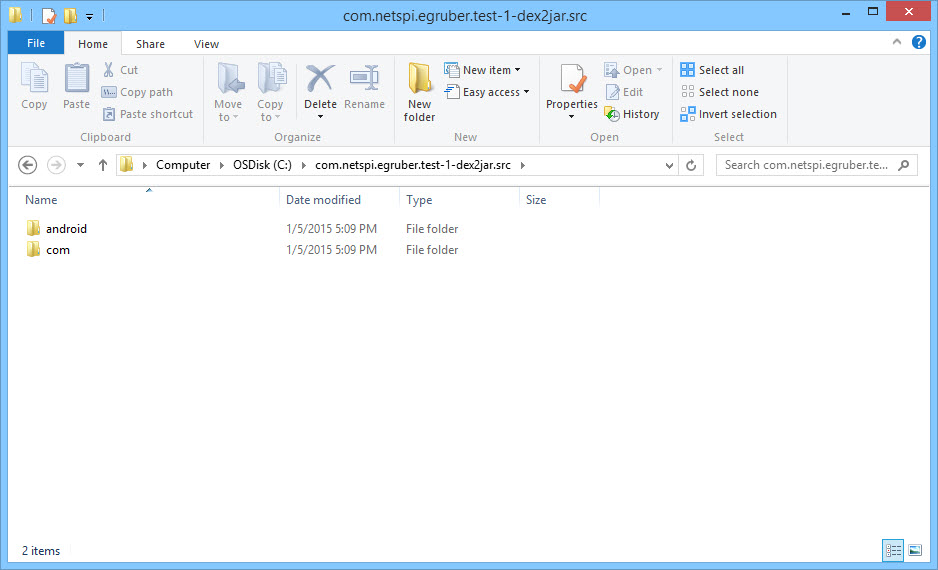
You should now see the package structure of the jar file. Inside all of the packages should be java files complete with readable source code. What we’re going to do now is save all of the source code to a zip file by selecting File > Save All Sources.
After the source has been saved, unzip it into its own directory.
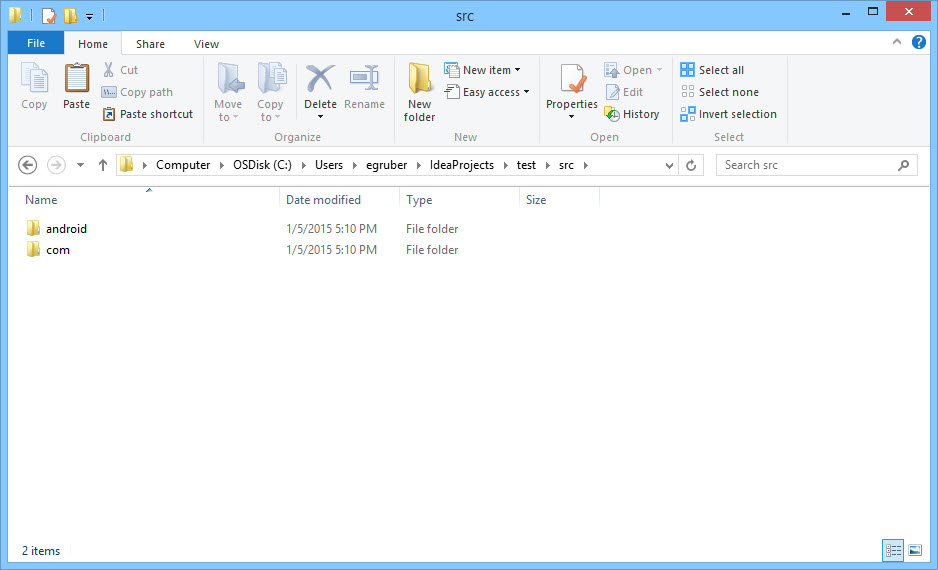
Now we need to import these two directories into our Android project in our IDE. For IntelliJ, navigate to the src folder of your project and paste the two directories in there.
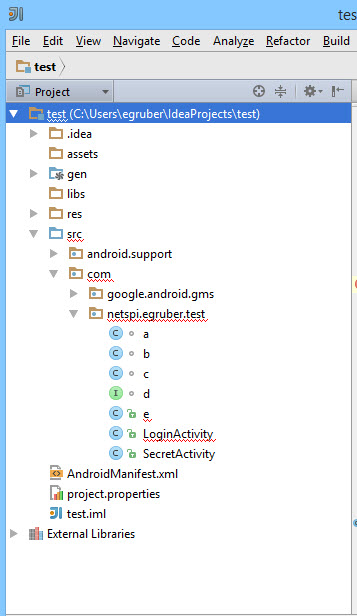
If we go back to the project in Intellij, the project structure should update.
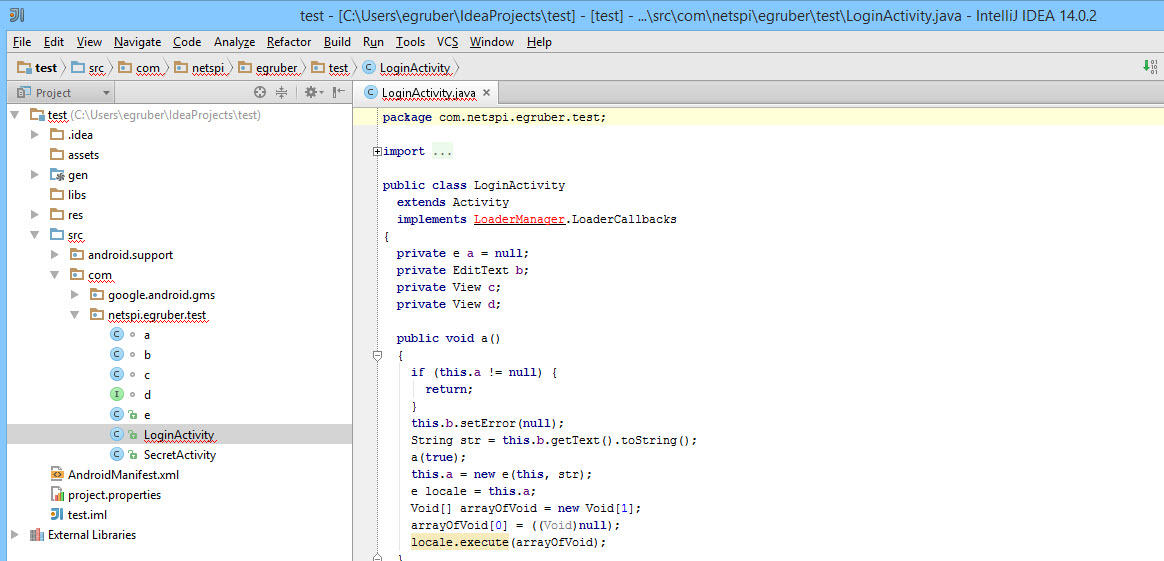
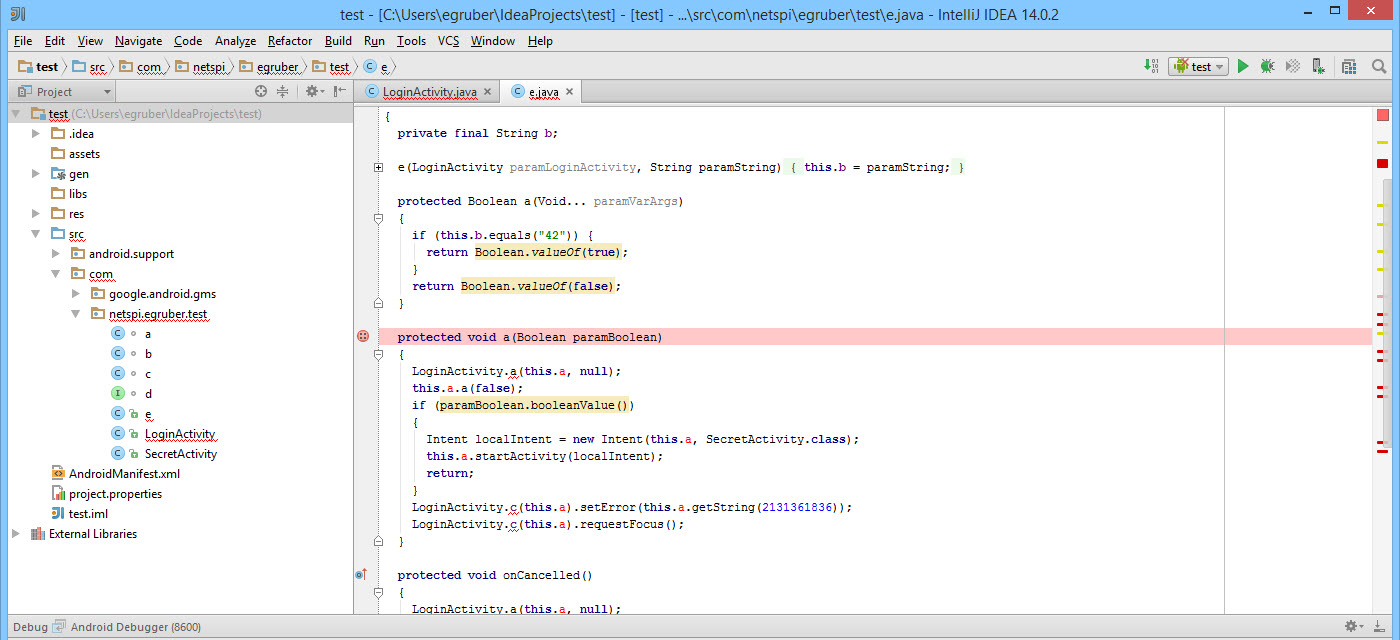
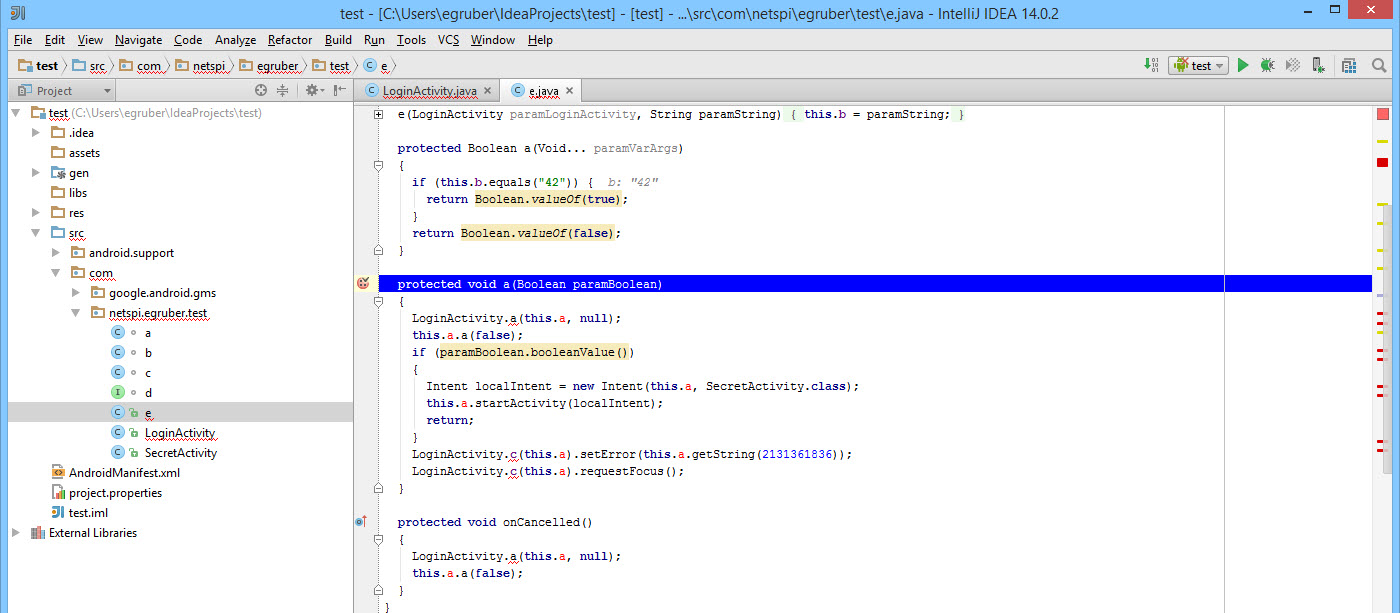
Clicking on one of the imported activities should show the source code. As you can see from the screenshot, the source code I imported is obfuscated using ProGuard.
Attaching the Debugger
Now that we have our project populated with source code of the application, we can then start setting breakpoints on method calls and variables to pause the execution of the process when those are reached. In this example I am setting a breakpoint on a method when someone enters a value into a text box. This does work with obfuscated code.
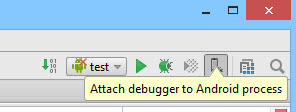
After the breakpoint has been set, attach the debugger to the application process on the Android device by selecting the little screen icon in the upper right hand corner. This may be different depending on your IDE.
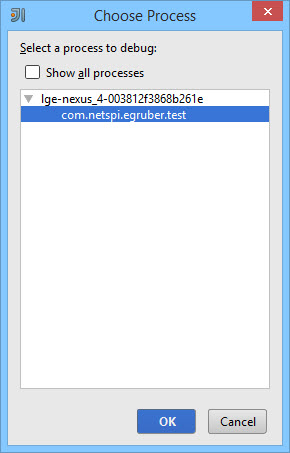
Next you will be prompted to choose a process on the device. Only debuggable processes will appear.
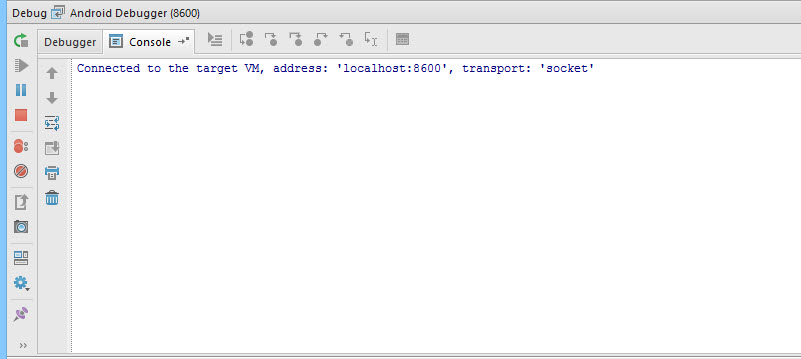
After selecting the debuggable process, the debugger will connect to the device.
In my test application, I will enter the number “42” into the text box that we have a breakpoint set for.
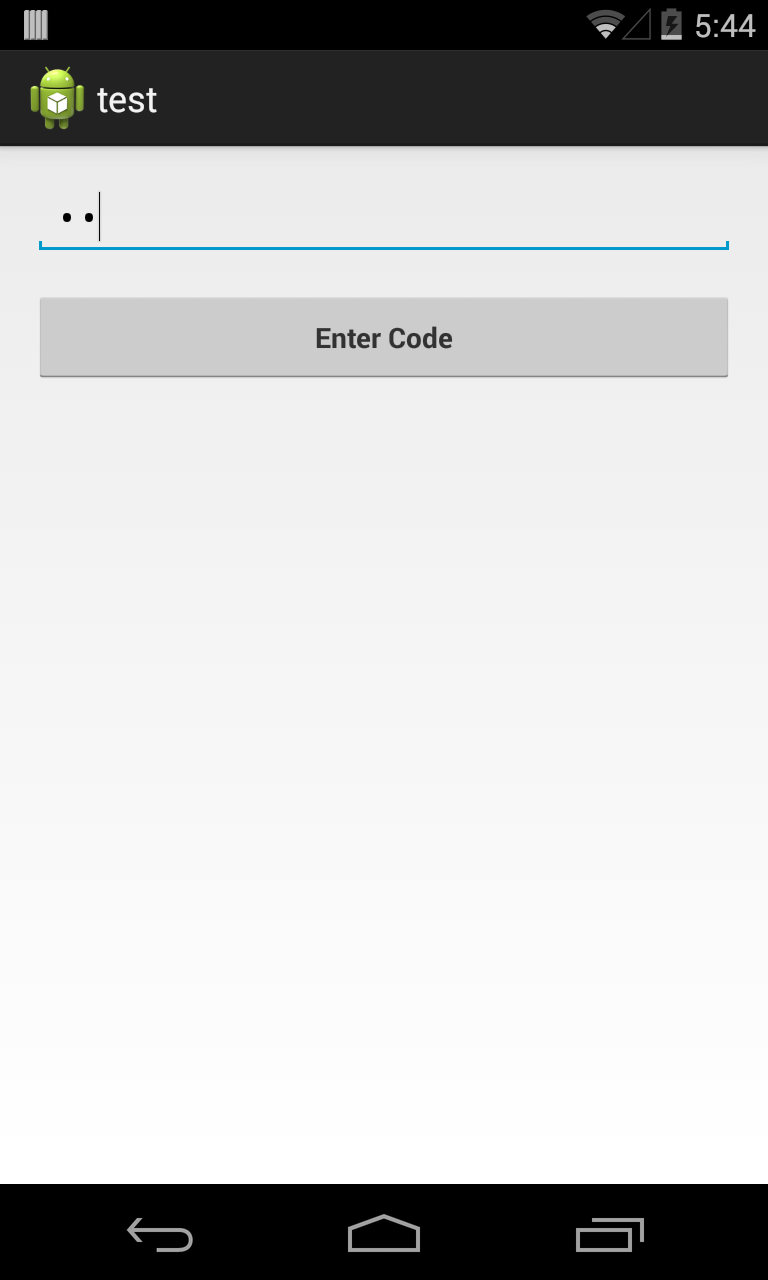
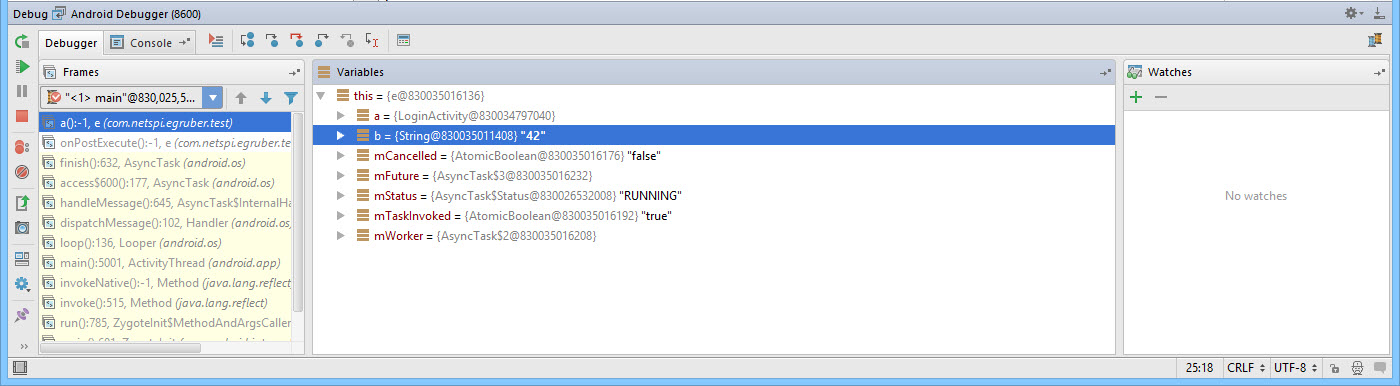
After selecting “Enter Code”, the process pauses execution at the breakpoint. The reason why this works is because the debugger knows what is being called on the device. The compiled Android application contains debug information such as variable names that are accessible to any debugger that understands the Java Debug Wire Protocol (JDWP). If an Android application allows debugging, a JDWP compatible debugger, such as most Java IDEs, will be able to connect to the Virtual Machine of the Android application and read and execute debug commands.
We can see that value that we entered into the application under the variables section.
Conclusion
From here we can not only read data from the application, but also insert our own. This can be useful if we wanted to interrupt the flow of the program and possibly bypass application logic. By debugging, we can get a better understanding of how Android applications perform certain actions that we would otherwise be unable to see. This can come in handy especially when we need to view how encryption functions are being used and the values of dynamic keys. It is also helpful when debugging functions that interact with the filesystem or a database to see when and how information is being saved. Without the need of root privileges, we have the capability to perform these types of tests on any Android device.